The PDF Report Designer user interface
This section is designed to provide an introduction to the basics of using the PDF Report Designer to design a Sample PDF Report template. For assistance with advanced functions and/or designing a report template, contact tech_support@softgenetics.com. |
When you are designing a Sample PDF report template, you have two parts to the design. You must specify the filters and sort order for the table of variants that is contained in a Sample PDF report that is based on the template, and then you must design the report template. You specify the filters and sort order in the PDF Report Designer Data Sources dialog box, and you design the report template in the PDF Report Designer dialog box. The PDF Report Designer Data Sources dialog box opens first after you select the PDF Report Designer option on the Reports menu. It displays a placeholder for the table of variants with the following default values:
• Filter - None. The table of variants is not filtered in the Sample PDF report.
• First sort and Sort Order - The table of variants is sorted first by Chromosome and Chromosome Position (Chr:ChrPos) in ascending order (Asc).
• Second Sort and Sort Order - The table of variants is sorted second by Pathogenicity in ascending order.
You can leave the default values as-is, or you can change any or all of the values. To change the Filter option, a Sort option, or a Sort Order option, double-click in the appropriate field to open a dropdown list, and then select a new value.
• Filter - Select from a list of Variant Filters (displayed by name) that you have added to the Geneticist Assistant or that other users have added to the database and made available to all users.
• Sort - The available sort options are pulled from the variant annotation columns of the Sample Variant Data sub-tab columns.
• Sort Order - Two values are available, ascending (Asc) and descending (Desc).
After you have set the values for the table of variants, then at the bottom of the PDF Report Designer Data Sources dialog box, click Show Designer to open the PDF Report Designer. When the PDF Report Designer opens, all panes other than the Data Browser pane and Script pane are blank. The Report Structure pane displays a placeholder for adding a new object to the first page of the report template
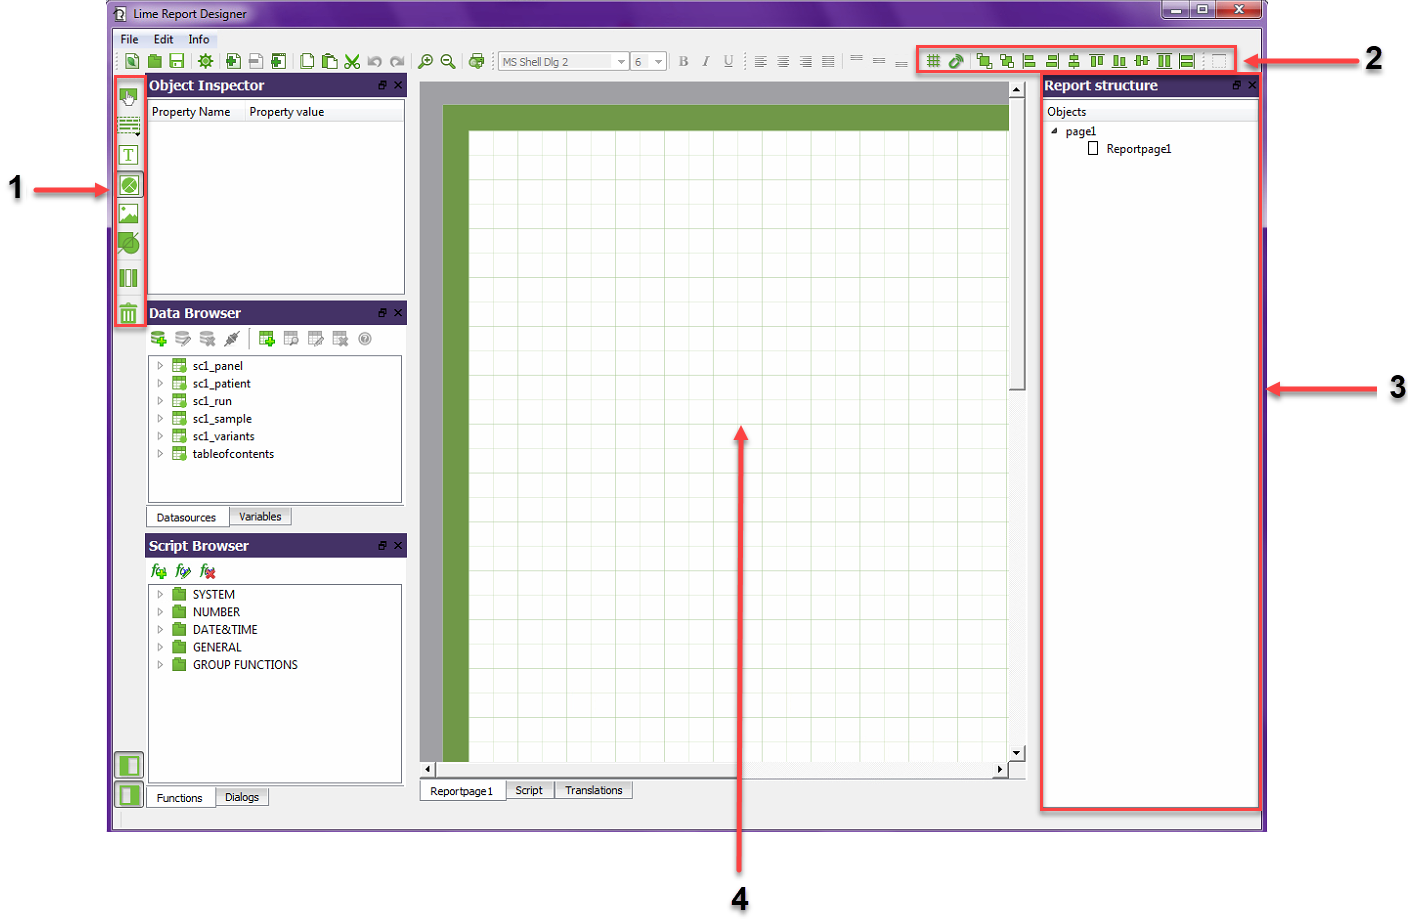
Option | Description |
|---|---|
1 | Object Inspector toolbar. Contains options for adding objects, such as a text field, to a report page. Hold your mouse pointer over an icon on the toolbar to open a tooltip that explains the icons’ function. See Object Inspector toolbar. |
2 | Object toolbar. Contains options for working with objects on a report page, such as aligning objects or snapping objects to the grid. Hold your mouse pointer over an icon on the toolbar to open a tooltip that explains the icons’ function. See To add and arrange Data band items. |
3 | Report Structure pane. Lists all the bands and objects that are displayed on a currently opened page of a Sample PDF Report template. |
4 | Work Area. You build a Sample PDF Report template in the Work Area. See Sample PDF Report template layout. |