Sequence tab
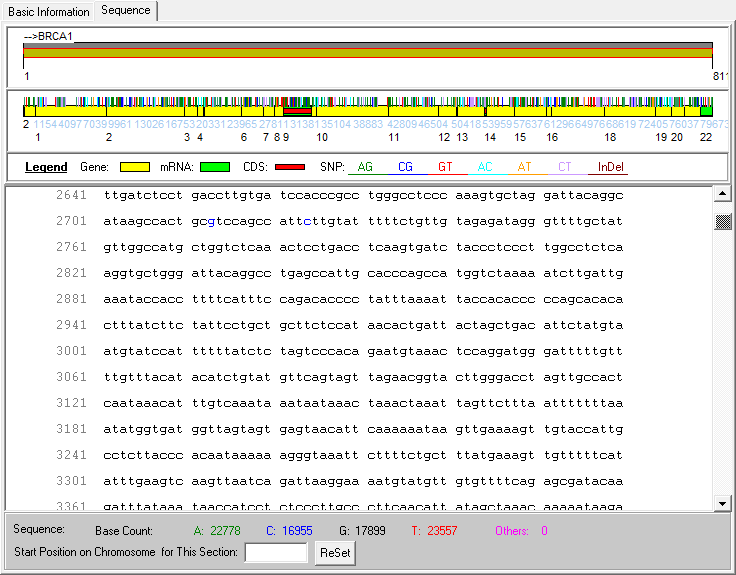
The Sequence tab provides a visual representation of the gene. A color-coded bar chart representing the gene is displayed in the middle pane of the tab. mRNA regions are shown in green and CDS regions are shown in red. SNP locations are indicated by small vertical lines above the bar chart. These lines are also color-coded according to the base change that they represent. The lower pane displays the full sequence for the region. mRNA regions are again displayed in green and CDS regions are again displayed in red. The amino acid sequence is also provided below the CDS sequence. SNPs are displayed in blue.
Advanced GBK Editor window, Sequence tab
The Sequence tab is interactive. To search for a specific sequence, on the Advanced GBK Editor Tool main menu, click Search > Find to open the Find Sequence dialog box. You enter the sequence for which to search in this dialog box, and you can also indicate whether to search by the complementary sequence. If the sequence is found, it is displayed in purple and italics in the Sequence tab.
Located sequence in Sequence tab
