Transcriptome project with Alternative splicing view
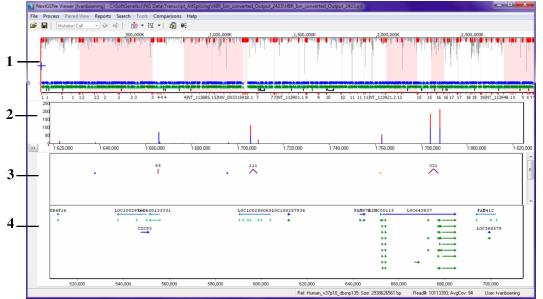
After you open a Transcriptome alignment project with Alternative splicing in the NextGENe viewer, the TSC Show Transcript Report option is available on the Report Selection icon. Select this option to open the Transcript report and to display the project in the transcriptome project view. From top to bottom, the transcriptome project view has the following visualization options that are specific for a transcriptome project: (1) Global coverage, (2) Localized coverage, (3) Identified transcripts with exon links, and (4) Annotation. Forward coverage is always shown in blue and reverse coverage is always shown in red in the Localized Coverage pane.
Transcriptome project view (Transcript report hidden)
Links in the project view are color-coded to indicate the different types of links.
Link Color | Description |
|---|---|
Purple | A link that matches the annotation for the gene. (Annotated link). |
Blue | A link that is not represented by any annotation for the gene. (Novel link). |
Black | A link that represents a gene fusion. (Fusion link). |
Regions in the project view are also color-coded to indicate the different types of regions.
Region | Description |
|---|---|
Purple | An exon that matches the annotation for the gene. (Annotated region). |
Blue | An exon that is not represented by any annotation for the gene. (Novel region). |
Red | Insertion and intron retention. |
Pink | An exon that is found in the annotation for the gene, but was not found in the data. (Exon skipping). |
Orange | A start or end to an exon that differs from the annotation for the gene. (Alternative splice site). |
Gray | An alternative start for the first exon for the gene or an alternative end for the last exon for the gene. (Alternative transcript start/stop). |
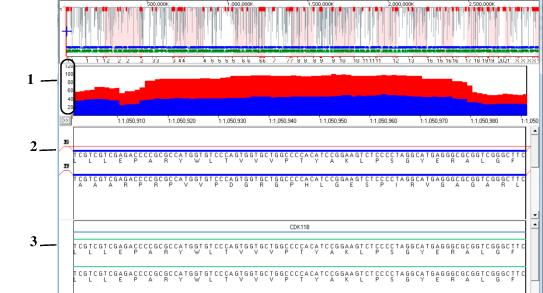
If you zoom in on a local region for a Transcriptome project, then:
(1) – The Y axis indicates the localized coverage. You can manually adjust the scale for the axis.
(2) – The nucleotide sequence and the amino acid sequence for the detected transcripts are displayed in blue.
(3) – The annotated transcripts are displayed in green below the nucleotide and amino acid sequences.
Zooming in on a local region for a transcriptome project