AUTOMATED LONG-TERM CHIMERISM MONITORING
Short Tandem Repeats (STRs) provide a highly sensitive measure of chimerism in post-BMT monitoring which is essential for long term tracking of engraftment and early detection of possible relapse. ChimeRMarker® software was developed in collaboration with Dr. Don Kristt, providing accurate chimerism detection, quantification and long term monitoring. ChimerMarker software is compatible with data from all major capillary electrophoresis systems, including but not limited to ABI®PRISM, Applied Biosystems® SeqStudio, Hiachi High-Tech Compact CE Sequencer DS3000, Promega Spectrum Compact CE Systems and Syntol Nanophore® 05 genetic analyzers, and custom primers or commercially available human identification chemistries for STR genotyping (including, but not limited to Identifiler®, GlobalFiler™ 6-Dye™, PowerPlex®16, PowerPlex®ESI, GenePrint® 24, PowerPlex®Fusion 5 and 6 Dye, Investigator®24Plex). The program has user-friendly linked navigation, so there’s no need for error-prone data transfer. The longitudinal graphs are easily appended with results from sequential time-based samples. The report header provides verification of the user and the analysis parameters.
Single Donor Longitudinal Report
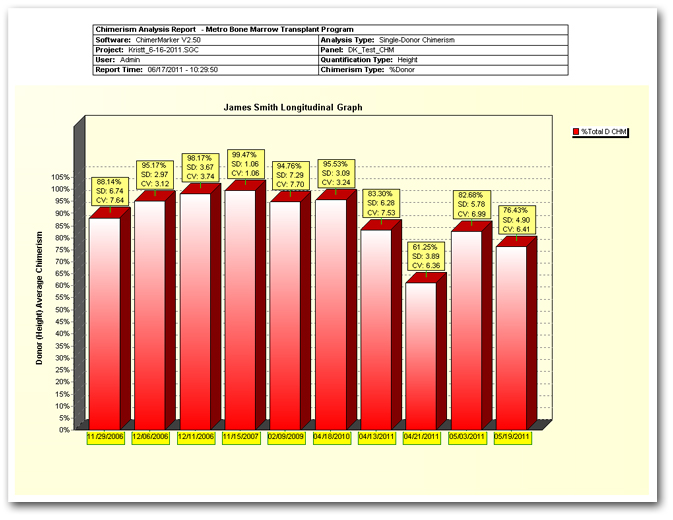
Figure 1: The Percentage Chimerism (donor or recipient) is displayed in the Y-axis. Sample date is displayed in the X-axis.
The longitudinal graph is automatically saved and easily appended with the sequential time-based samples during the monitoring time period. The header includes institution, user, and analysis parameters.
Double Donor Longitudinal Report
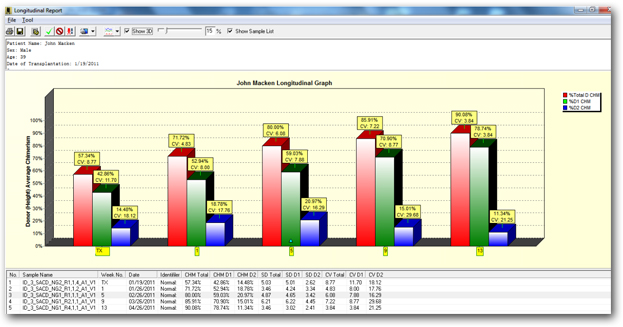
Figure 2: This Double donor monitoring interface displays the trend of engraftment with an increase in overall chimerism and Donor 1 stability and a decrease in Donor 2 chimerism percentage. In this example the analyst entered Tx to indicate sample at transplant and then the weeks post-transplant for the sequential samples.
Analyst Interface on ChimeRMarker Software

Figure 3: Add analyst comments via the dialog box
Patient information, addition of sequential samples and comments, printing, and saving are easily accomplished using the tool bar icons. The graph selection includes bar format (shown here) or line graph format. Quality control metrics are included in the graph and result tables.
Webinars: