SINGLE DONOR CHIMERISM DETECTION, QUANTIFICATION AND MONITORING
Chimerism analysis using a PCR-based method of short tandem repeat (STR) markers has grown to be the most widely used method for chimerism analysis of stem cell engraftment, over fluorescent in situ hybridization (FISH) and other cytological methods. Informative markers provide rapid detection and quantification of chimerism level in stem cell engraftment monitoring can be assessed with high confidence. However, there are multiple challenges to this analysis method, including selection of informative loci to measure chimerism, filtering stutter peaks, accurate genotyping of alleles, heterozygous imbalance, PCR amplification bias, the repetition of quantifying chimerism for individual time points from multiple cell types and determining donor and recipient peaks in post-BMT samples. ChimeRMarker® software combines robust data analysis, automated routine chimerism calculations for unique and shared peaks and flexible reporting, increasing throughput and reducing errors.
Automatic Labeling of Donor, Recipient and Shared Peaks in Chimeric Samples
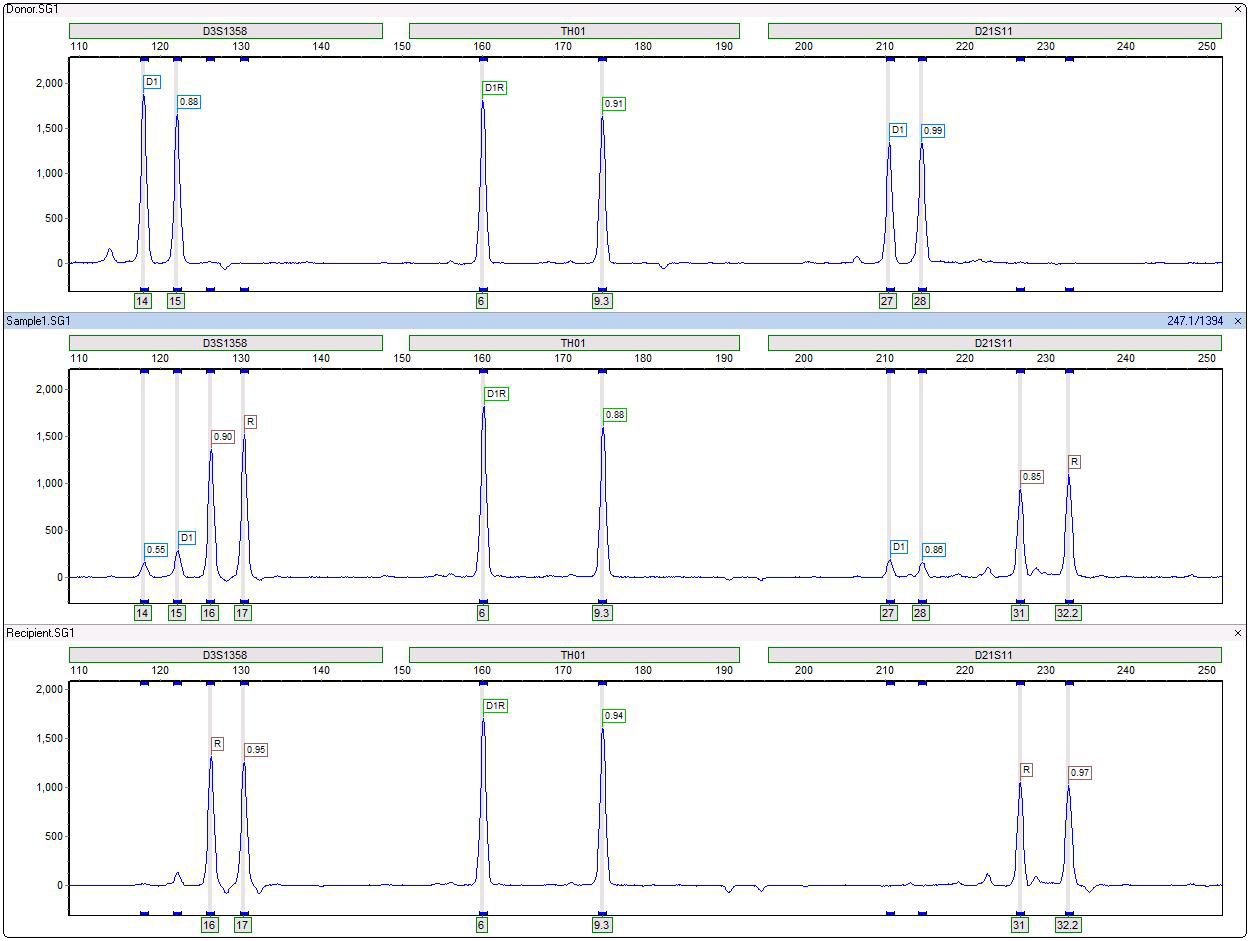
Figure 1: TH01 is an example of a non-informative locus due sharing of all peaks in donor and recipient. D3S1358 and D21S11 are informative loci since they have unique fragments in donor and recipient, with very little heterozygous imbalance in the original single source samples. The stutter filter does not call these artifact peaks.
Chimerism Calculations Separate Contributions of Donor and Recipient in Shared Peak - Providing Greater Number of Informative Loci
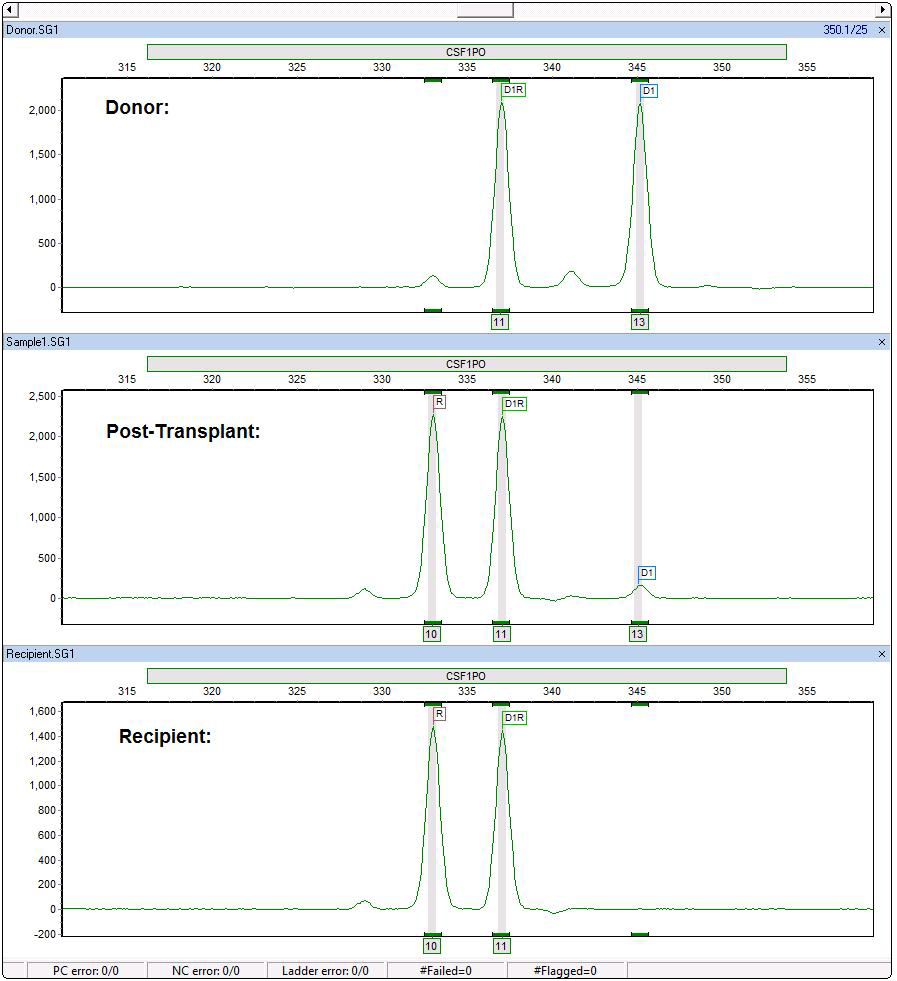
Figure 2: CSF1PO is also an informative locus. ChimeRMarker software recognizes the shared peak (D1R), donor peak (D1) and recipient (R). The automated chimerism calculations separate the contribution of donor and recipient in the post-transplant sample (including single shared peaks) as seen in the final report below.
Final Report includes Header with Electronic Verification of User, Electropherograms and Calculation Results Table
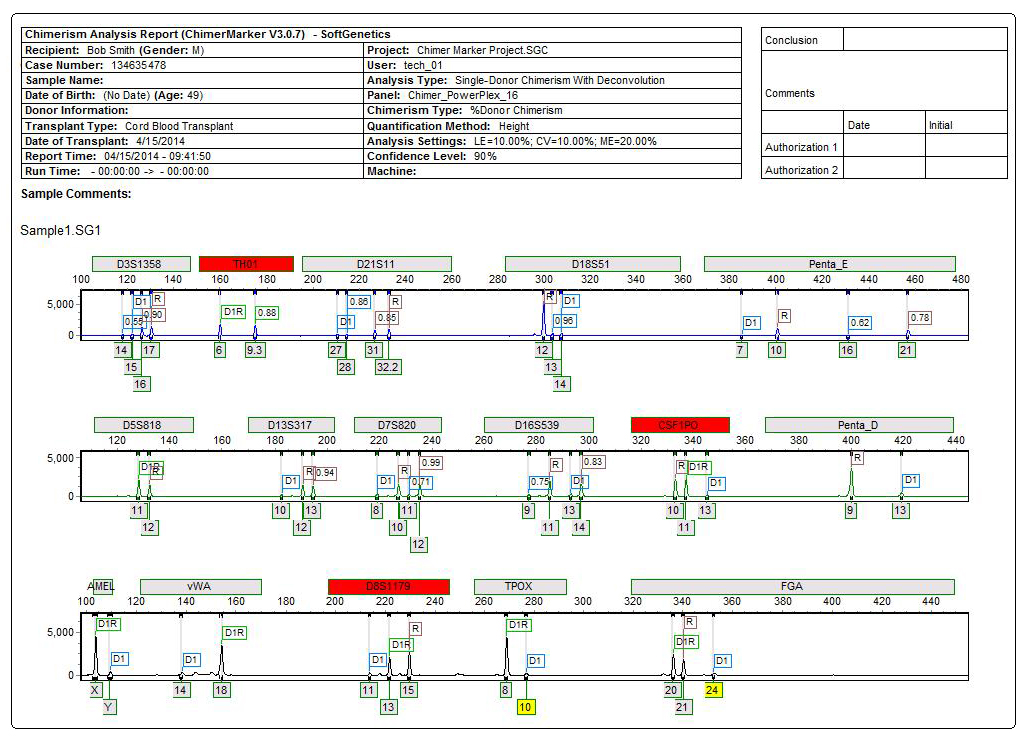
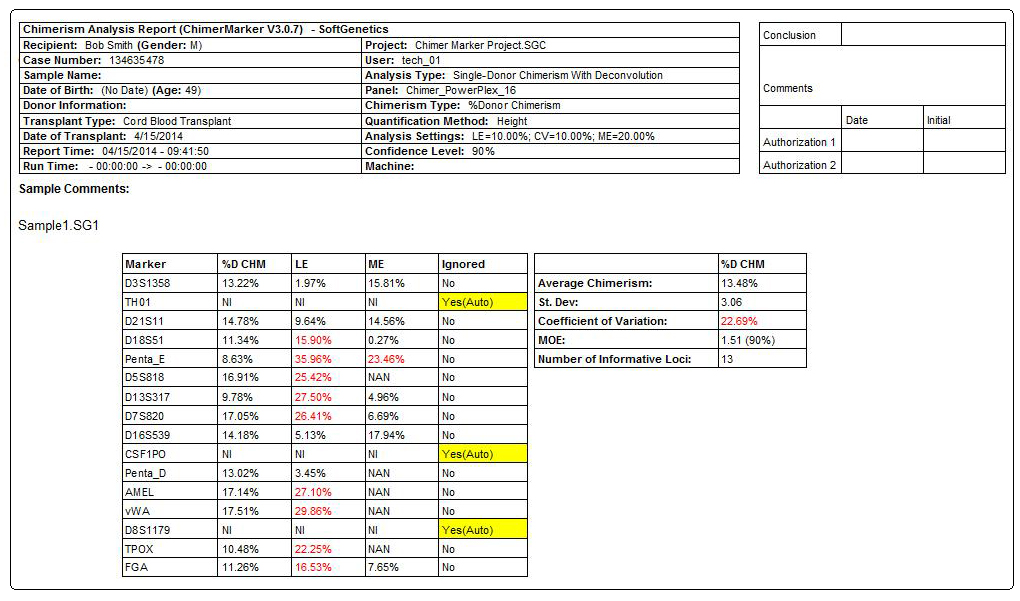
Figure 3: Comprehensive report for PostTX sample includes header, electropherograms (traces) and report table. The header uses information from User Management and selected analysis parameters to record technician, project, time, date, and analysis settings for electronic record keeping. The electropherogram (trace) shows each dye separately with labels for D (donor), R (recipient), or combinations for shared alleles (D1R). The result table includes quality control metrics: coefficient of variation, standard deviation, average chimerism for sample, measurement error, and locus error for each marker and the total average Chimerism Percentage. Marker labels for uninformative loci (TH01 and vWA) are in red in the electropherogram and denoted with Nil (Non-Informative Locus) in the report table.
Webinars: