Monitor Coverage in Regions of Interest
Geneticist Assistant NGS Interpretative Workbench automatically monitors coverage depth, flagging regions to the base level that do not meet your pre-set requirements. The software will track the amplicon or regions' performance over time, providing feedback on the sequence performance, which may alert you to areas that require performance improvement. This feedback is maintained in the Knowledge Database.
Quality data is presented for both the current sample and a complete history of analysis of all samples for a disease panel.
Metrics provided include:
- Minimum Coverage
- Average Coverage
- Percent Covered across region
- Pass/Fail Status of the current run.
Historical data includes:
- Average coverage of all runs
- Average percent covered
- Absolute Pass/Fail counts
- Total samples for the region
- Passed percentage
Sequencing that often fails is easily reviewed, allowing the user to determine and correct the cause of sequencing failures. Examples of the quality data display are shown below.

Sample Values on Coverage Regions Tab: Coverage metrics for the sample are reported for each panel region
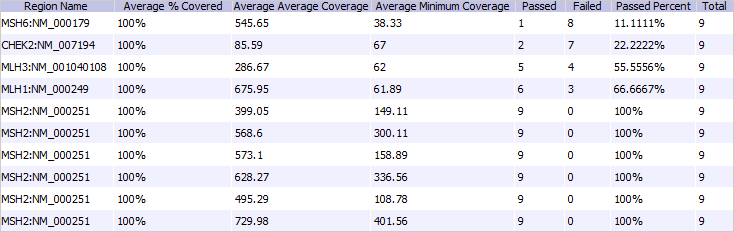
Average Values on Coverage Regions Tab: Average coverage metrics, as well as pass/fail rates, are reported for all samples submitted for the panel