Paternity Analysis
GeneMarkerHID human identity software’s embedded paternity analysis follows the AABB Standards for Relationship Testing Laboratories, Appendix 8, for determination of paternity and maternity for family trios, motherless cases and reverse parentage.
The point-and-click operation enables the analyst to automatically:
- Draw pedigrees, providing accurate and rapid comparison of STR profiles from family members.
- Verifies paternity exclusion or inclusion by identifying allele conflicts (between parents/child(ren) or siblings) with results in a table and pedigree graphic.
- Deduces missing parent profile based on offspring allele calls where possible.
The analyst can select from two options for relationship statistics:
- Classical paternity trio calculations (using the PI formulas of AABB Standards for Relationship Testing Laboratories, Appendix 8) with PI, PE and CPI, CPE in an exportable table.
- Identity-by-descent, providing likelihood ratios of related versus random individuals in a population.
Both methods in GeneMarkerHID software use the mutation rates of AABB and pre-loaded allele frequency tables for US Populations or easily import allele frequencies of other population databases. GeneMarker® HID software is concordant with GeneMapper®ID and GeneMapper®IDX software compatible with output files major capillary electrophoresis systems (including ABI®PRISM, Applied Biosystems SeqStudio™, Hiachi High-Tech Compact CE Sequencer DS3000, Promega Spectrum Compact CE Systems and Syntol Nanophore® 05 genetic analyzers, Rapid DNA systems (such as RapidHIT™-ID, RapidHIT™ and ANDE®) as well as custom primers or commercially available chemistries including but not limited to those from Promega, QIAGEN and Thermo Fisher.
Figures 1 – 3 (below) provide an overview of the embedded paternity analysis application.
The Family Group tool automatically draws paternity trios. Allele conflicts are linked to the electropherograms for immediate identification in paternity tests.

Figure 1: This is an example of a typical paternity exclusion case showing the linked pedigree and electropherograms. Allele Conflicts in the pedigree diagram are linked to the electropherograms for rapid review of loci that are not in agreement with the parental genotypes.
Visualize pedigrees and Calculation Results in one view
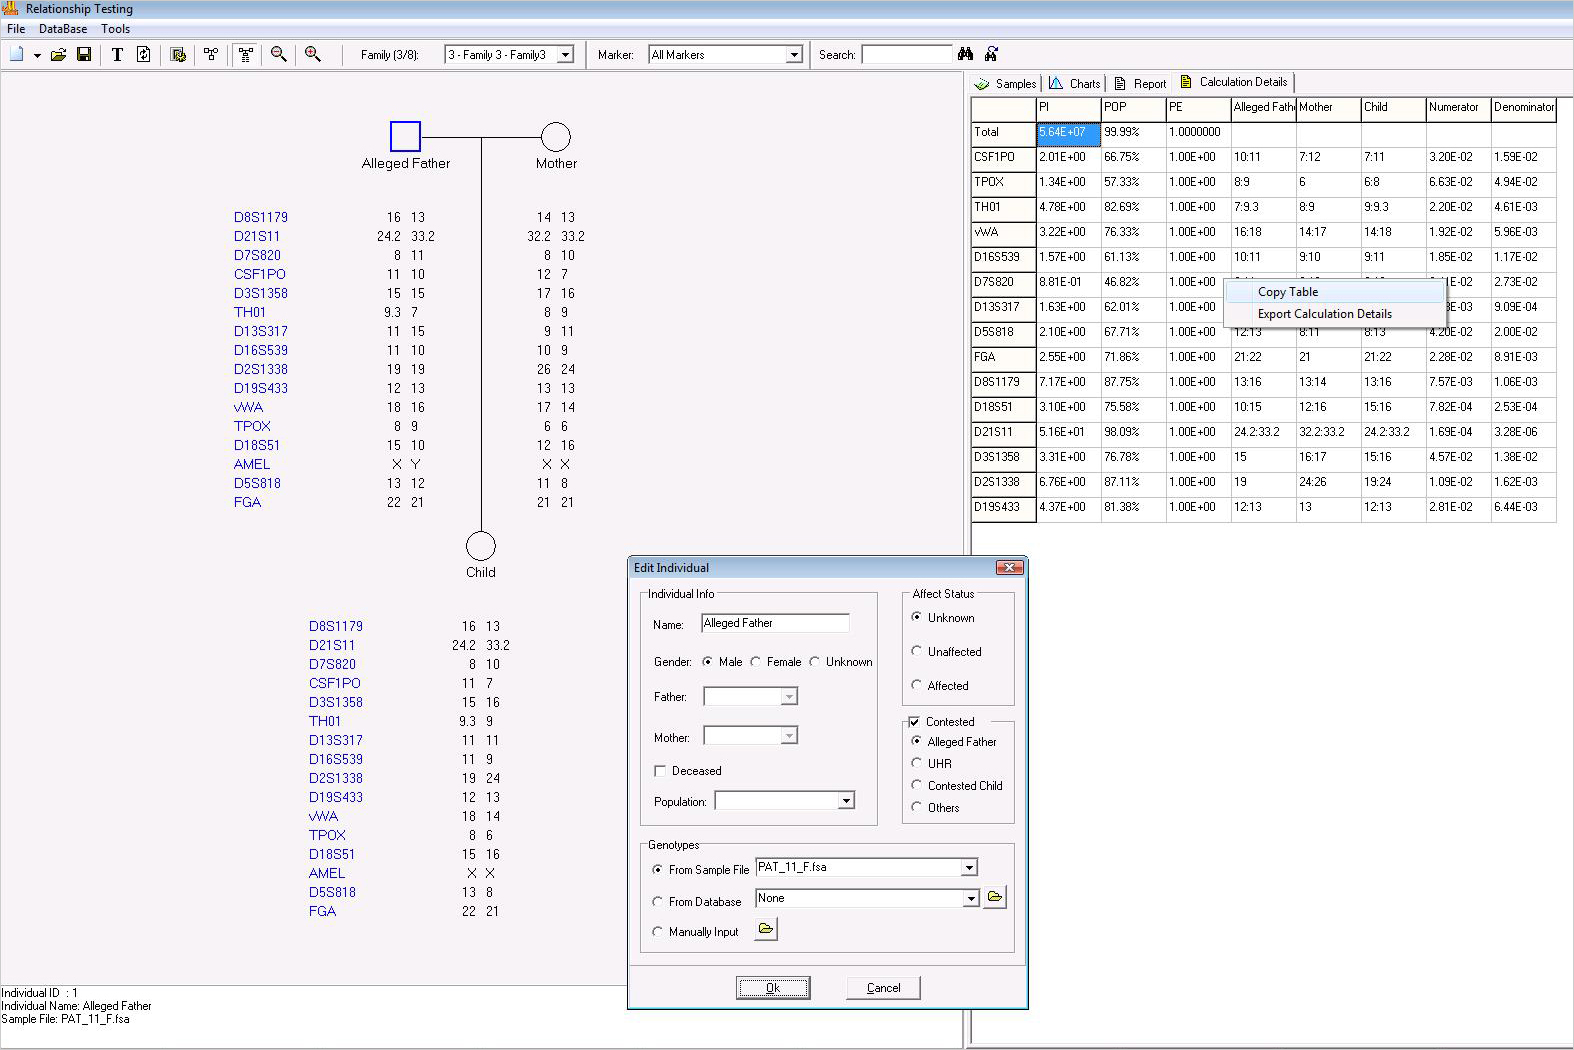
Figure 2: The alleged Father is selected using the ‘Edit Individual’ dialog box and the appropriate population in the allele frequency tables. The ‘Calculation Details’ tab provides an exportable table with the PI, POP and PE for each locus and the combined values for this typical paternity inclusion case. The results are calculated using trio calculations of AABB. If one of the parental genotypes is not available, the motherless equations are used to calculate PI and PE.
Calculate Likelihood Ratio from results of a Database Search using Identity by Descent Calculations
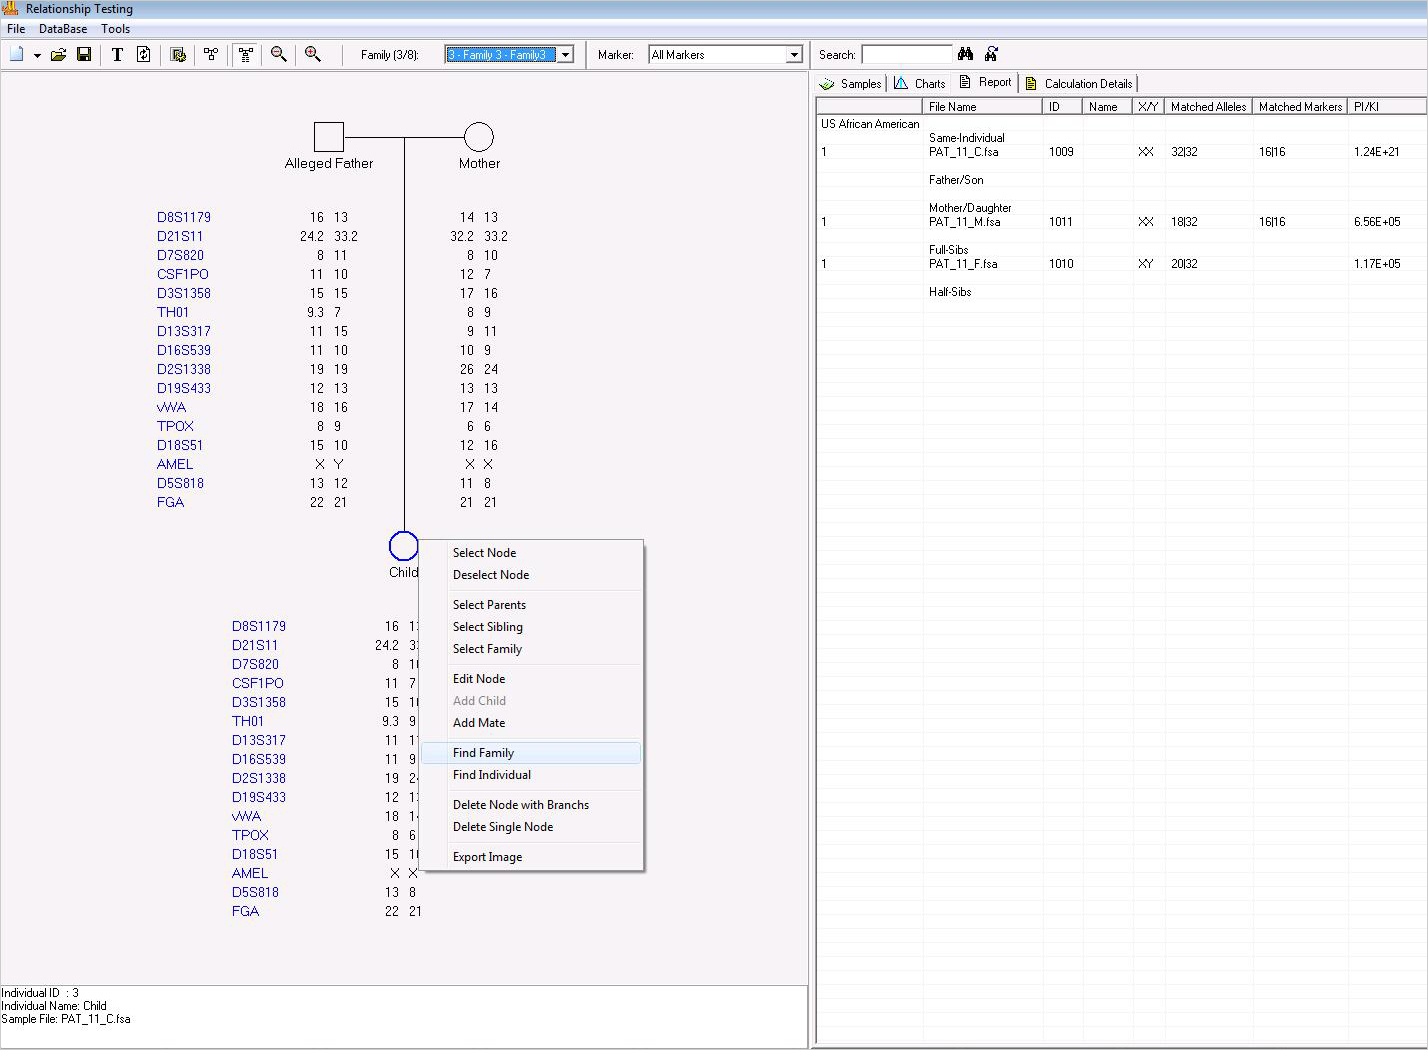
Figure 3 is an example of using the Find Family option to search the database when the pedigree includes known relatives. The ‘Find Family' option searches the database for any potential relatives and calculates the likelihood ratio. This feature may be used with or without known relatives in a pedigree drawing. It uses identity by descent to compare the file in question with all files in the relationship testing database.
Application Notes:
Webinars: