Time Saving Quality Evaluation Tools in GeneMarkerHID software include Rapid Concordance Testing of Replicate STR Profiles
Forensic scientists often prepare multiple replicates of their DNA samples for databasing, casework, mixture analysis, and paternity testing. These samples are amplified using human identification PCR chemistries, or some other multiplex STR system, and the products then undergo capillary electrophoresis on either an ABI®PRISM, Applied Biosystems SeqStudio™, Promega Spectrum Compact CE System, or a rapid system (such as RapidHIT™ and RapidHIT™ID). This technique lessens the impact of allele dropout and other common artifacts, and allows the analyst to confidently deduce a consensus genotype. GeneMarkerHID software, already preloaded with kinship analysis, database search, and mixture deconvolution applications, is also equipped with the Replicate Comparison Tool, which allows researchers to quickly check replicates for differences and determine the resulting consensus genotype. Replicates may be compared based solely on allele calls, or by peak height, size, and/or area. GeneMarkerHID software supports several reporting formats, including text, excel, CODIS, and customizable print reports.
Figures 1 – 5 provide an overview of the Replicate comparison tool.
The Replicate Comparison Tool - Main View

Figure 1: In the replicate comparison tool, different replicates of the same sample are grouped together and then compared. The results are displayed in the report table, and the alignment of the replicates is displayed in the electropherogram. The comparison settings are flexible, meaning replicates can be compared simply by the allele call at a given marker, or by additional parameters such as peak size, height, and/or area.
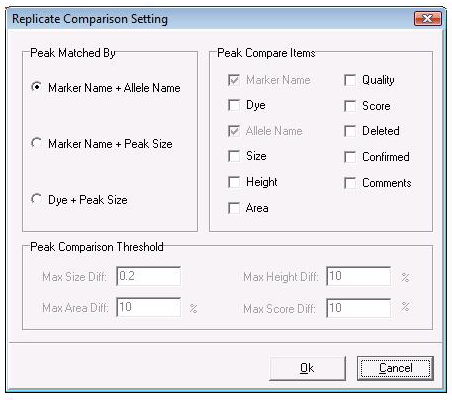
Figure 2: Use the Replicate Comparison Settings window to choose which parameters to compare for each replicate. For some parameters (size, area, height, and score) the user may set a range of allowable values.
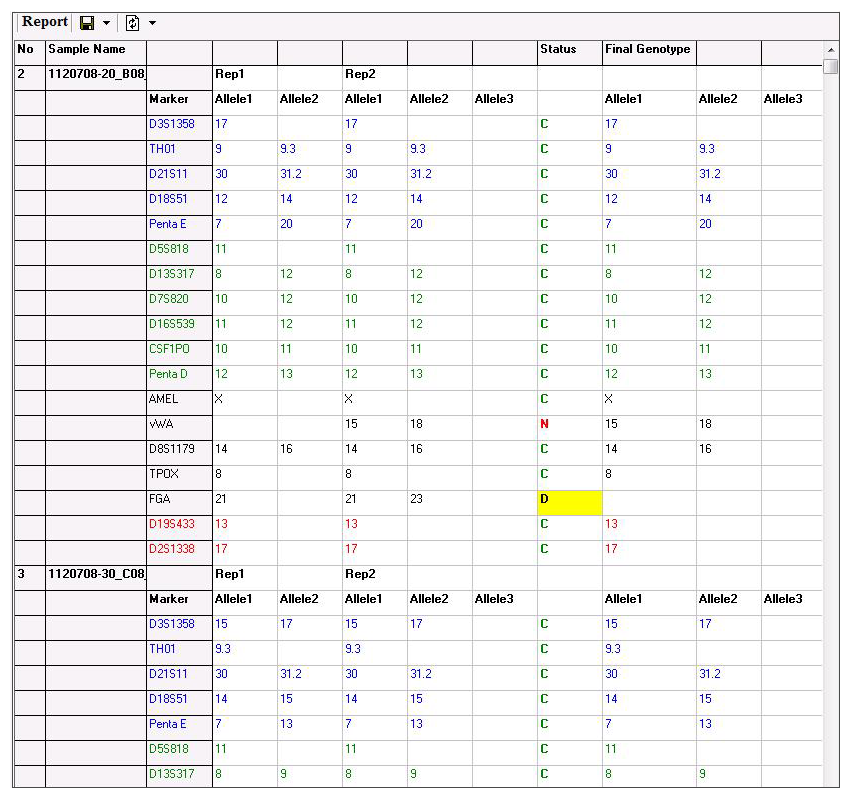
Figure 3: The report table displays the allele call for each replicate at a given marker, the results of the comparison of those calls (concordant, discordant, or null), and also gives the consensus genotype at the specified marker. This table can be exported as a tab-delimited text file.
The informative report table displays the allele calls for each replicate at the specified marker, the “status” of that marker, and the Final Genotype at that locus. The status column for a specified marker will display a C for Concordant if the replicates have the same call, a D for Discordant if the call is different, and an N for Null if only one replicate has allele calls (i.e. the other replicates failed). The report table is linked with the electropherogram, simply click on an allele or the corresponding status to be taken to that locus in the electropherogram.
For markers with C and N calls, the final genotype column is automatically filled with the available genotype. In cases where the status is D, the user may manually select the genotype of that locus from a dropdown menu. The final report may then be exported as a tab-delimited text file.
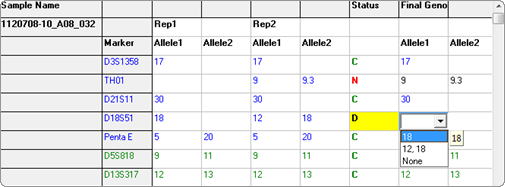
Figure 4: For discordant (conflicting) replicates, the user may manually select the genotype of the specified locus.
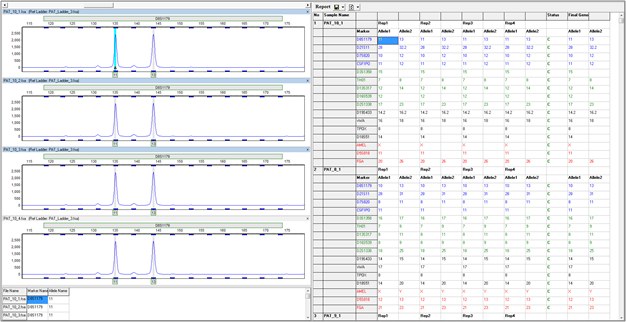
Figure 5: The replicate comparison tool can comfortably accommodate more than two replicates in each group. Shown above is a project in which four replicates were processed for each sample.
Application Notes:
Webinars: