USER-FRIENDLY, EXPERT SYSTEM FOR HUMAN IDENTIFICATION GENOTYPING OF FORENSIC DNA SAMPLES
Forensic DNA typing expert systems software (as described by NDIS) offers automated sizing and analysis of electrophoretic output, reducing the time required to accurately designate the profile and expediting the process of DNA analysis; thus reducing casework backlogs by flagging peaks to alert the analyst when defined criteria are not met.
GeneMarker®HID human identity software is concordant with GeneMapper® ID/GeneMapper® ID-X with many additional, unique features that decrease analysis time and analyst fatigue including:
- Accurate size calling and pattern recognition technology
- Three easy-to-use dialog boxes to set parameters for consistent analysis and auto-run
- Customizable viewing modes
- Linked navigation
- Automatic intensity-scaling
- Quality flagging and audit trail
To prevent any changes to validated analysis protocols and SOPs, administrative controls allow control of user access rights, customization of work-flow and reports such as CODIS report, Allele Reports to import into LIMS; Missing Persons, Crime Scene or Familial statistics results.
GeneMarker® HID software is concordant with GeneMapper®ID and GeneMapper®IDX software and and compatible with output files major capillary electrophoresis systems (including ABI®PRISM, Applied Biosystems SeqStudio™, Hiachi High-Tech Compact CE Sequencer DS3000, Promega Spectrum Compact CE Systems and Syntol Nanophore® 05 genetic analyzers, Rapid DNA systems (such as RapidHIT™-ID, RapidHIT™ and ANDE®) as well as custom primers or commercially available chemistries including but not limited to those from Promega, QIAGEN and Thermo Fisher.
Three Simple Clicks to Analysis
Setting analysis parameters is accomplished through 3 easy-to-use dialog boxes. Once parameters have been set, they can be saved for future analysis, allowing for “single-click” operation of the AutoRun feature. Analysis settings include options to: correct common chemistry artifacts (Pull-up, Peak Saturation, Spike Removal), select positive control template, auto-panel adjust, and select best ladder for run-to-run and capillary-to-capillary variations.
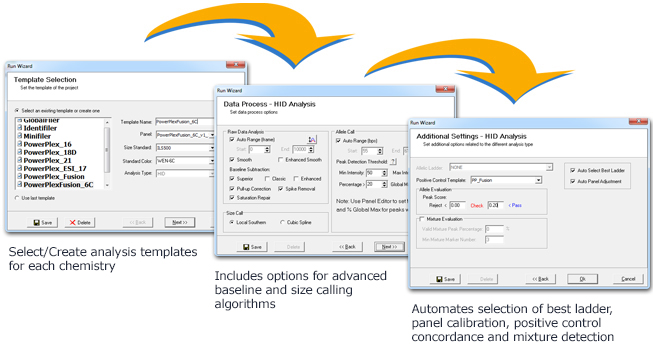
Figure 1: Displays the ‘Template Selection’, ‘Data Process’, and ‘Additional Settings’ customization windows.
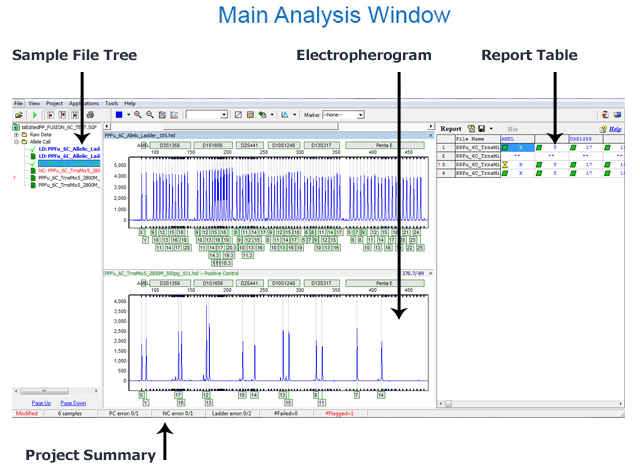
Figure 2: The image above labels each section of the main analysis window: the sample file tree, electropherogram, report table, and project summary.
Figures 3 – 5 Illustrate the Customizable viewing modes, Automatic RFU intensity-scaling, Linked Navigation, Quality flagging and audit trail
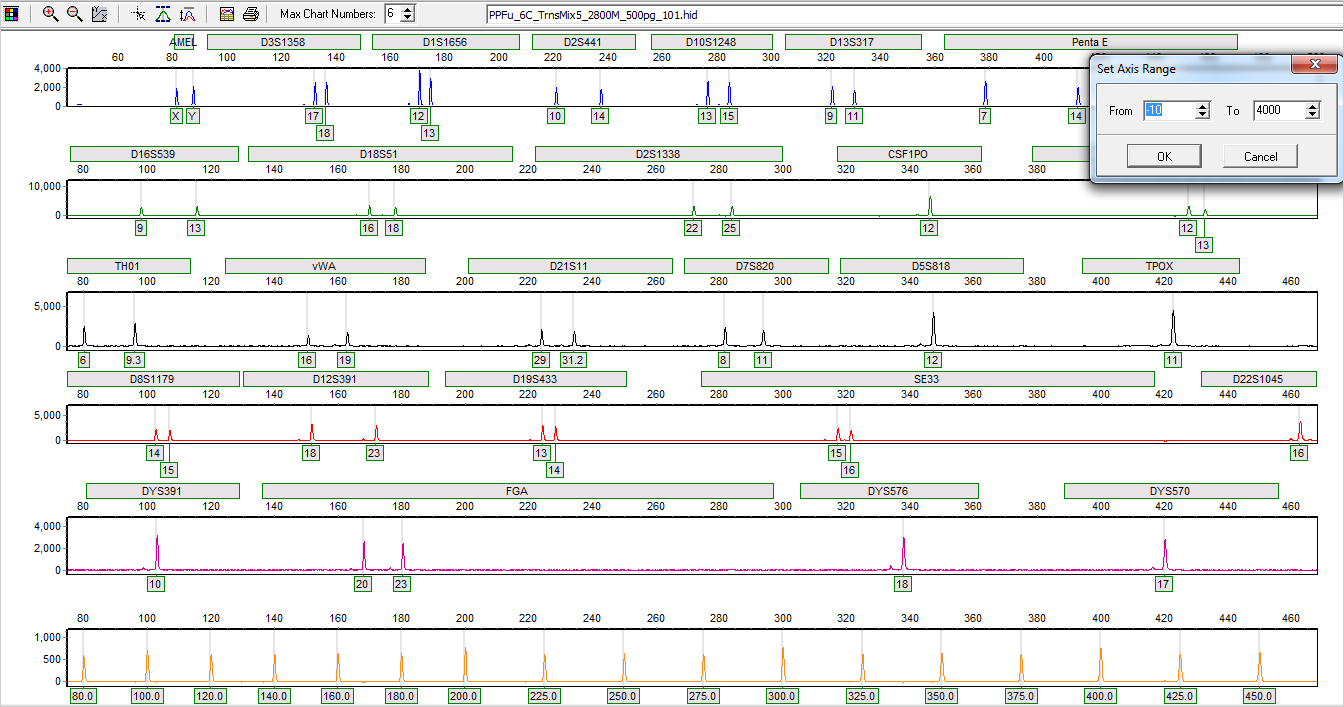
Figure 3: All Color Browser for review/edit/comments on all dyes of a profile. Includes options for automatic scaling of Y axis to the tallest peak in each dye, or manually setting the Y-axis for each dye.
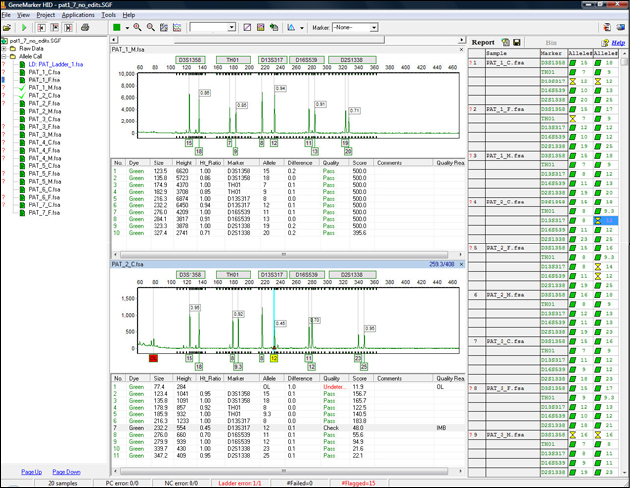
Figure 4: The main window of GeneMarkerHID software has an easy to use layout. The sample files are displayed on the left. Electropherograms appear below the gel image, and the Report Table is on the right side of the window. To open and close the frames use the Show/Hide icons in the main toolbar.
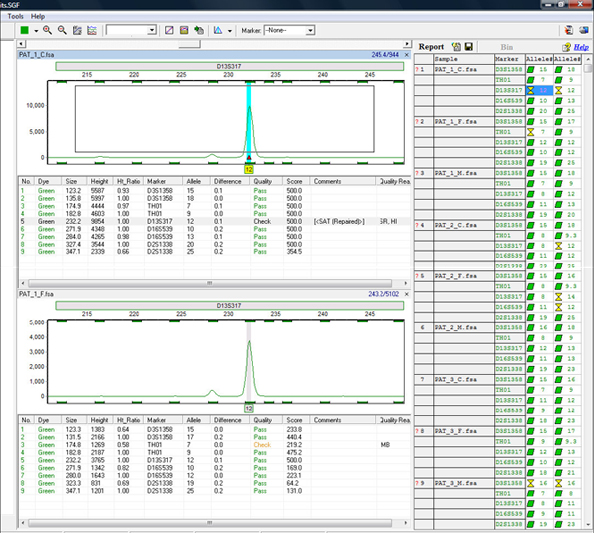
Figure 5: GeneMarkerHID software has linked navigation, meaning the user can use the mouse to click on a peak to highlight the details in the peak table below the electropherogram and in the allele report at the right. Quality flagging reasons are automatically entered in the table. All edits and comments are also saved in the file history. Easily Zoom-in or out using the mouse to draw a box around the region of interest or double click on the cell of the report table to display the marker. Stutter filters are customized for each marker in the panel editor