Increase Analysis Efficiency and Rework of Low-Quality Samples with the Automated Quality Sensor Evaluation: A Component of the Embedded Time Saving Tools of GeneMarkerHID Software
Amplification inhibitors and degradation can complicate forensic profile analysis by producing incomplete genotypes from casework samples. Common amplification inhibitors, such as indigo dyes from denim and hemoglobin are thought to decrease Taq DNA polymerase by binding to the active site of the enzyme. Degradation starts at the time of death due to degradative enzymes and also from environmental conditions, such as UV irradiation. Globalfiler_IQC and Investigator 26 and Investigator 24 are examples of PCR kits that use internal quality sensor peaks. QIAGEN provides a 2-fragment internal control in the Investigator® Quality Sensor which saves time and improves workflow by providing information dealing with failed PCR amplification, absence of DNA, inhibited DNA and degraded DNA (see Table 1). Analysts use the quality sensor peaks to provide essential information of problematic samples, based on the presence/absence or peak height ratios of the Q and S fragments in combination with the peak heights of the sample profile.
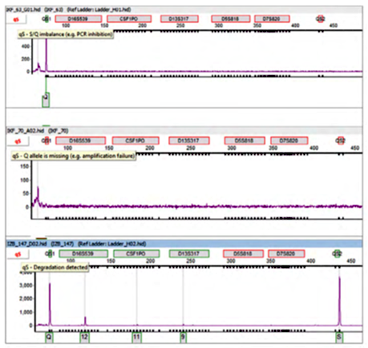
While these Quality Sensors improve the laboratory workflow by improving the understanding of results and aiding decision making, analysts need to make a subjective judgment on these markers to use them. GeneMarkerHID software provides further efficiencies by providing parameters to automatically flag samples that break any of the rules for Q and S quality sensor peaks. GeneMarkerHID software provides additional time savings and avoids potential human bias when evaluating samples that have unacceptable peak heights or decreasing peak height. (Figures 1 and 2)

Table 1: Summarizing the visual interpretation for the range of Q and S peaks in problematic samples. (summarized from Technical Information Investigator® Quality Sensor, www.Qiagen.com)

Figure 1: These are example electropherograms showing qS flags. Mouse-over them to display a pop-up message with information about the rule fired.

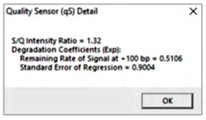
Figure 2: Mouse click the qS flags to display pop-up Quality Sensor (qS) Detail message with details about the rules fired. In this case, the rule fired was for exponential degradation of peak height with the increasing fragment size.


