Copy Number Variation Tool
The CNV detection tool of NextGENe software includes a sophisticated coverage-based algorithm developed for NGS sequencing data from instruments such as Illumina, and Ion Torrent sequencing platforms. NextGENe’s CNV Tool is applicable to both whole exome and targeted sequencing panels such as Ion Torrent AmpliSeq panels or the HaloPlex Target Enrichment System from Agilent Technologies. Copy number variations can be detected in NGS sequencing data using dispersion measurements and a novel Hidden Markov Model (HMM) not found in other programs, such as Partek Genomics Suite™. Specified regions of a "sample" project and a "control" project (or a synthetic control based on several projects) are used to determine a coverage ratio (sample divided by sample plus control) in every region. The coverage is measured in normalized read counts or RPKM. CNV calls are made on the basis of changes in coverage, utilizing automatic measurement of noise (dispersion) and a novel Hidden Markov Model. Additionally, each called region receives Phred-scaled scores describing the probability of "Deletion", "Duplication", and "Normal" CNV states. Results are available in a table and graphical view.
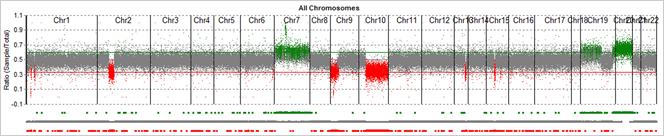
Figure 1: Graphical CNV view. Whole exome CNV results from a tumor-normal comparison. Regions called as deletions are shown in red, with lower copy number in the sample project compared to control project. Regions called as duplications are shown in green (increased copy number in the sample project). Grey regions represent normal regions, where there was not enough evidence to call a copy number variant.
Copy number variations are detected by comparing the coverage of regions in the sample and control projects. Regions are defined by annotation or incremental length for whole exome sequencing projects, and a BED file for targeted sequencing projects. A beta-binomial model is fit to the coverage ratio (similar to ExomeDepth software [1]) in order to model the amount of dispersion (noise). Simple classifications are used for likelihood values of each region, such as “Duplication” (increased copy number), “Normal” (little evidence of CNV), “Deletion”, or “Uncalled” (due to low coverage).
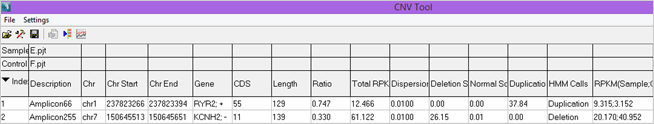
Figure 2: Portion of the CNV Report from a HaloPlex Cardiac Panel Comparison
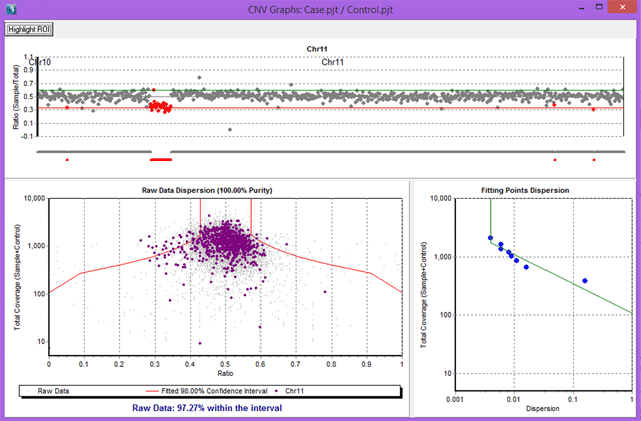
Figure 3: Results for an Ion Torrent Comprehensive Cancer Panel comparison, with chromosome 11 selected
In addition to a novel HMM method, NextGENe software also features a proprietary SNP-based normalization method which utilizes a unique method for normalizing coverage between two samples. A list of heterozygous SNPs with allele percentages close to 50% is generated for each sample, and the median coverage for these alleles is used to normalize the samples on a global level. After normalization, a representative position for each region is selected and used to calculate a log2 coverage ratio which is used to determine the CNV call – “Deletion,” “Duplication,” or “Normal”.
[1] Plagnol, Vincent, et al. “A robust model for read count data in exome sequencing experiments and implications for copy number variant calling. “Bioinformatics 28.21 (2012): 2747-2754.
Application Notes:
- NextGENe CNV Detection- Dispersion and HMM
- Mutation Detection and CNV Analysis for Illumina Sequencing data from HaloPlex Target Enrichment Panels using NextGENe Software for Clinical Research
- Copy Number Variation Detection Poster presented at 2013 ABRF conference
- 2016 ASHG Poster: Evaluation of the NextGENe CNV caller for Use in the Clinical Laboratory, T. Lewis, ARUP Laboratories
- Copy Number Variation (CNV) Detection using Targeted Sequencing Data with NextGENe® Software v2.3.1
- Mutation Detection and CNV Analysis for Illumina Sequencing data from HaloPlex Target Enrichment Panels using NextGENe Software for Clinical Research
Webinars:
- CNV Algorithm: Dispersion and HMM
- Mutation Detection and CNV Analysis for Illumina Sequencing Data from HaloPlex™ Target Enrichment Panels
- CNV Detection using Ion AmpliSeq™ panels or the HaloPlex™ Target Enrichment System Targeted Sequencing Data with NextGENe® Software
Pricing & Trial Version:
Reference Material:
Trademarks property of their respective owner