NGS replacement for MLPA® and Similar Analysis Techniques with the NextGENe® software’s Batch CNV Tool.
NextGENe’s Batch CNV Tool provides capability for CNV detection by comparing a batch of samples to one another all at once, without requiring controls samples. The Batch CNV Tool was developed in collaboration with Dr. Bekim Sadikovic and colleagues, Western University, Pathology and Laboratory Medicine London Health Sciences Centre, and St. Joseph's Health Care London, Ontario, Canada users.
The use of NGS and NextGENe software's Batch CNV Tool for screening dramatically increases laboratory throughput while significantly reducing the cost of MLPA Analysis. This robust tool can be used to replace Multiplex Ligation-dependent Probe Amplification and similar techniques, typically performed by capillary electrophoresis (CE) fragment analysis, with High-Throughput or Next Generation Sequencing. The HTS approach to CNV does not use the problematic steps of traditional MLPA reactions, which are challenging to optimize. Steps in the MLPA protocol include: DNA quantification, denaturation, and ligation, which must be optimized to produce reliable results. In addition, the MLPA laboratory procedure is labor intensive.
The Batch CNV Tool allows users to take advantage of NGS attributes of:
- Higher throughout
- Lower costs
- Simplicity
“Detection of copy number variants is often performed using multiplex ligation-dependent probe amplification (MLPA). While it is sensitive, this method can be slow and labor intensive. High Throughput Sequencing (HTS) using targeted panels offers a different approach that is simpler, cheaper, and faster. Using a simple coverage normalization method with compatible data, it is possible to generate CNV calls with HTS and outperform the use of MLPA and Sanger sequencing” [1].
The choice of the library preparation method is very important for this analysis. Any method that produces inconsistent coverage from sample to sample will result in poor sensitivity and specificity. Samples prepared using SeqCap EZ Choice (Roche NimbleGen, Inc.) have been shown to work well with the tool.
The tool calculates the pileup coverage at each position in the targeted panel, normalizes it by a constant value in each sample, and reports the normalized values.
The normalization procedure is:
- Get the total coverage in each sample (adding the coverage at each position in the ROI bed file).
- Divide these values by the average across all samples to get the normalization factor for each sample.
- Divide the coverage at each position by the normalization factor for that sample.
- When reporting a value for a given region, reports the average of all bases within that region.
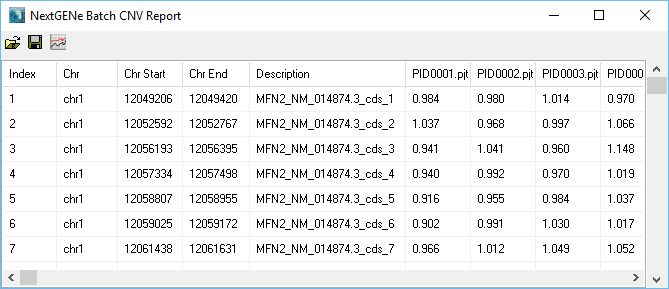
Figure 1: Table of Results
Any regions with an average normalized value outside the set thresholds (0.8 and 1.2 by default) will be highlighted as a CNV (Figures 2 and 3). The region names are taken from the 4th column of the BED file used to define the regions. Sub-region results (for example, within an exon) can be visualized (figure 4) in order to see potential sub-exon copy number variations.
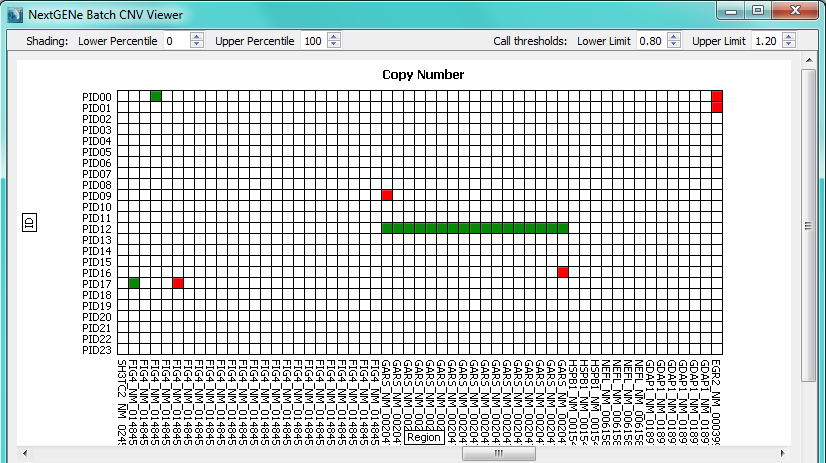
Figure 2: Global plot with samples in rows and regions in columns.
Red squares indicate a deletion call while green squares indicate a duplication call.
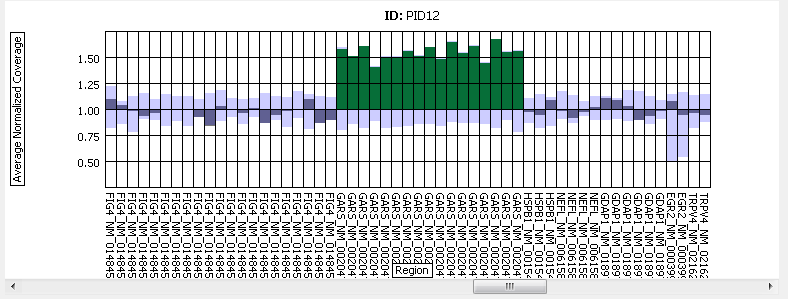
Figure 3: Results across several regions for a given sample.
A duplication of the GARS gene is shown.
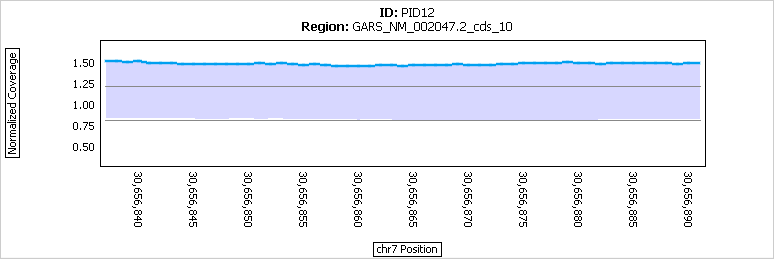
Figure 4: Results within an exon (that was called as a duplication) in a single sample.
The normalized coverage (blue) is consistently above the cutoff for a duplication call at 1.20.
Application Notes:
Webinars:
Pricing & Trial Version:
Reference Material:
- Download/View NextGENe® Brochure
- NextGENe User Manual
- Annotated Reference Genomes
- ASHG 2016 Poster: CLINICAL NGS PIPELINE OUTPERFORMS A COMBINED APPROACH USING SANGER SEQUENCING AND MLPA IN TARGETED GENE PANEL ANALYSIS
References:
[1] Schenkel, Laila C., et al. "Clinical Next-Generation Sequencing Pipeline Outperforms a Combined Approach Using Sanger Sequencing and Multiplex Ligation-Dependent Probe Amplification in Targeted Gene Panel Analysis.” The Journal of Molecular Diagnostics (2016).
Trademarks property of their respective owner