Customizable Reporting Options for Sanger Sequencing Projects
Mutation Surveyor software offers unique reporting options for Sanger sequencing projects, including resequencing, direct sequencing, PCR sequencing, and mitochondrial DNA (mtDNA) sequencing projects. Included in the software is the versatile Custom Report, which provides options to customize everything from sample grouping options to the types of mutations displayed. Reporting and organization options include the ability to reorganize sample/patient files, hide specific variants of non-interest, color-code pathogenicity, organize and output calls by specific regions of interest, include trace quality information, and report by preferred nomenclature (genomic position, cDNA/CDS, mRNA, HGVS, or custom nomenclature). Contained in this report is a unique Normal Allele Scoring method (NM_Score), indicating the contribution of the normal allele at the position compared to the contribution of the possible mutant alleles at the same position. Following detection of single nucleotide polymorphisms (SNPs), heterozygous and homozygous insertions and deletions (indels) and low-frequency variants (somatic, heteroplasmic, mosaic), the Custom Report template lets the user build their own report and quickly export in .txt, .xlsx, .xml, and .vcf formats. A VCF file allows for importation of results into Geneticist Assistant NGS Interpretative Workbench enabling the generation of a historical knowledge base of variants and annotation. These reporting options in the Custom Report provide enhanced flexibility superior to anything found in similar programs such as Thermo Fisher Scientific SeqScape®, Variant Reporter™, and Minor Variant Finder; DNAStar's SeqMan Pro™; Gene Code's Sequencher®; or JSI Medical Systems' SEQUENCE PILOT, allowing users to quickly meet internal reporting, LIMS, or other database requirements.
Multiple Sample Grouping Options
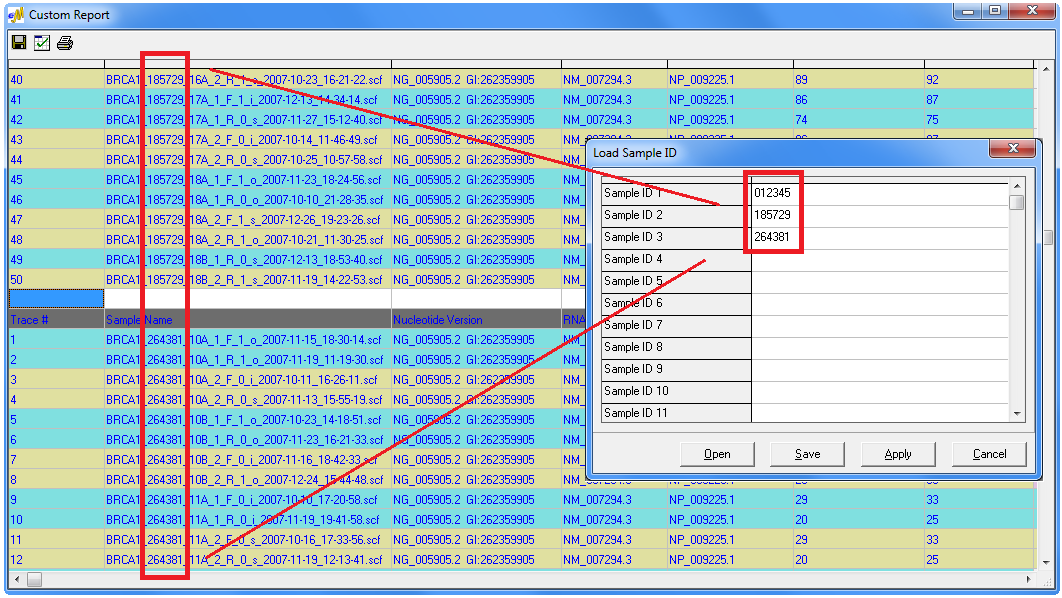
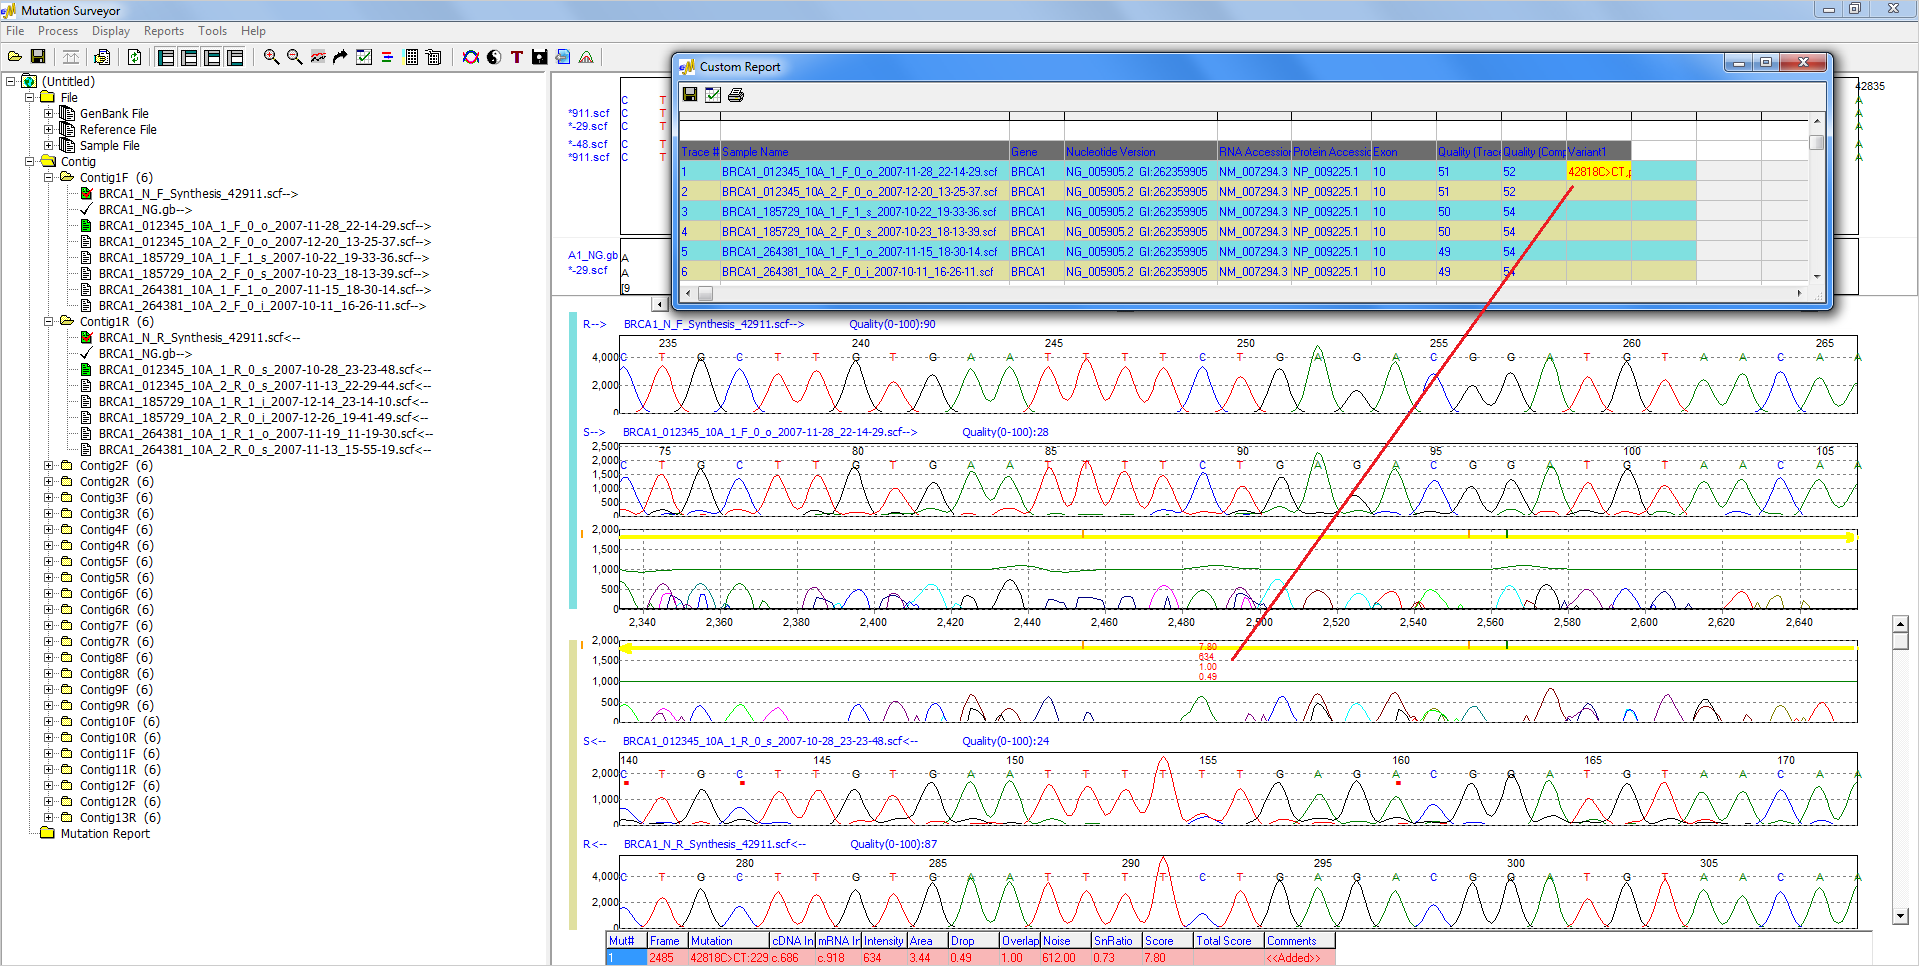
Figure 1: The Custom Report of Mutation Surveyor allows users to rapidly group sample files based on up to three orders of grouping options. Traces are initially grouped on their 1st order grouping option, and further sorting is carried out based on 2nd and 3rd order grouping options. Examples of grouping options include sample or patient identifier, contig, gene, exon, and trace position.
Mutation Filtering
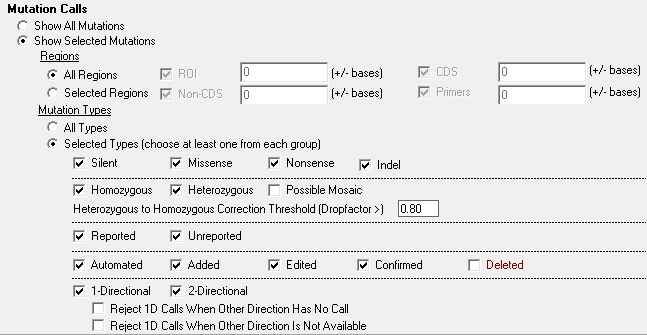
Figure 2: With a simple click users can filter mutation calls by parameters such as location within the genome or mutation type. Users can display mutations found within all locations or target mutations found in specific locations, such as custom regions of interest, CDS, or intronic mutations. A further level of filtering can be applied based on mutation type, which enables users to filter based on criteria such as silent, missense, nonsense, indel, homozygous, heterozygous, etc.
Trace Quality Information
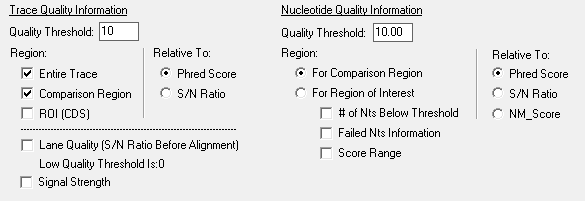
Figure 3: Quality metrics can be used in the Custom Report to identify traces and nucleotides with low quality. Trace quality can be assigned to the entire trace, comparison region, or ROI/CDS and can be reported relative to Phred Score or Signal-to-Noise Ratio. Those traces that do not meet a specified quality threshold are identified with a background color that is selected by the user. Nucleotide quality information can also be used to identify specific nucleotides that fall below thresholds set by the user.
Identify Variants with Color Codes
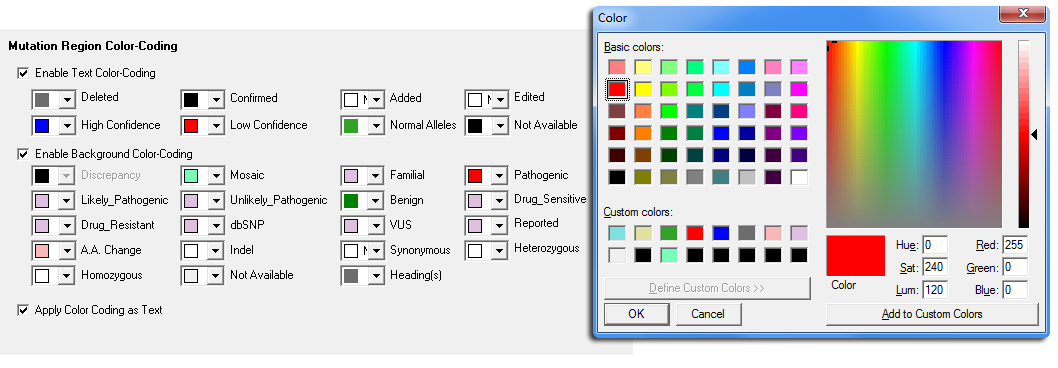
Figure 4: The color-coding options of the Custom Report provide a variety of options to assist the user with identifying different types of variants and potential analysis problems. Both text color coding and background color coding can be applied to identify areas of low quality, low confidence, confirmed variants, and mutation call discrepancies. Users can easily switch between reports and the Graphical Analysis Display for quick review and confirmation by double-clicking the specific variation in the mutation table.
Normal Allele Scoring
Mutation Surveyor software provides a confidence check on the absence of mutations at each nucleotide, greatly assisting in validating analysis results. All scores can be shown in the report by selecting the appropriate options.
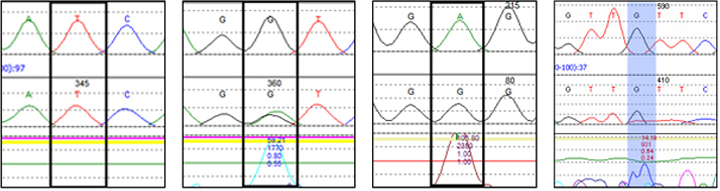
Phred Score: 50
NM_Score: 20.5
High Score
Normal Allele
Phred Score: 20
NM_Score: 1.4
Moderate Score
Heterozygous
Substitution
Phred Score: 51
NM_Score: 0.0
Low Score
Homozygous
Substitution
Phred Score: 11
NM_Score: 5.2
High Score
False Positive
Webinars:
Trademarks property of their respective owner