Mutation Quantification from Sanger Sequencing Traces
The quantitative information embedded within Sanger sequencing traces can be useful for DNA mutation, variation, and methylation analysis, including disease study. Detection and quantification of minor variants, including DNA mutation and methylation, is simplified in Mutation Surveyor software. The software rapidly and accurately aligns sample traces to a reference trace, detecting minor variants with greater than 99% accuracy and sensitivity as low as 5% of the primary peak. Mutation Surveyor software also includes a Mutation Quantifier tool, which provides a quantitative analysis of peak characteristics, enabling the user to easily calculate allelic proportions in Sanger Sequencing projects. The tool's flexibility provides two methods of quantifying peak ratios, including a simplified allele ratio based on peak Relative Fluorescence Units (RFU) and a standardized allele ratio for percent drop of the normal allele and percent gain of the mutant allele at specified locations. These locations within the genome can be quantified based on mutation calls or specified loci using reference coordinates.
The Mutation Quantifier Tool Aids in Further Analysis of Low-Frequency Variants
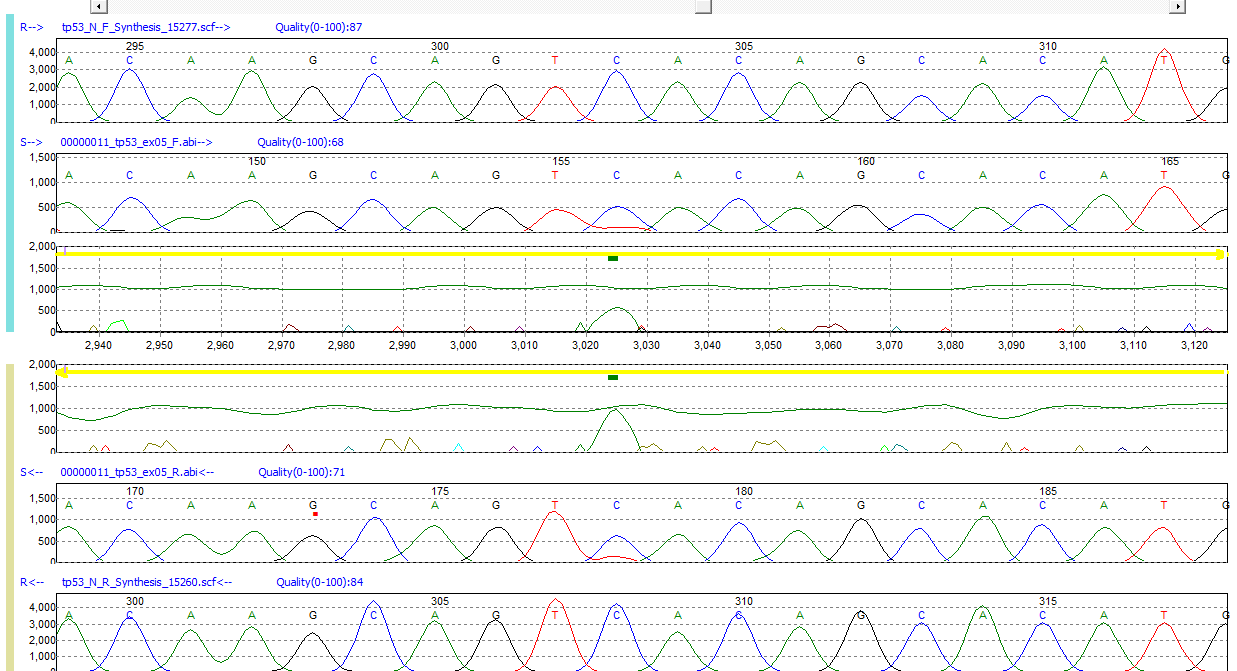
Figure 1: Low-frequency mutation C>CT detected in exon 5 of TP53 gene
Standardized Allele Ratio Calculates Percent Gain of Mutant and Percent Drop of Normal
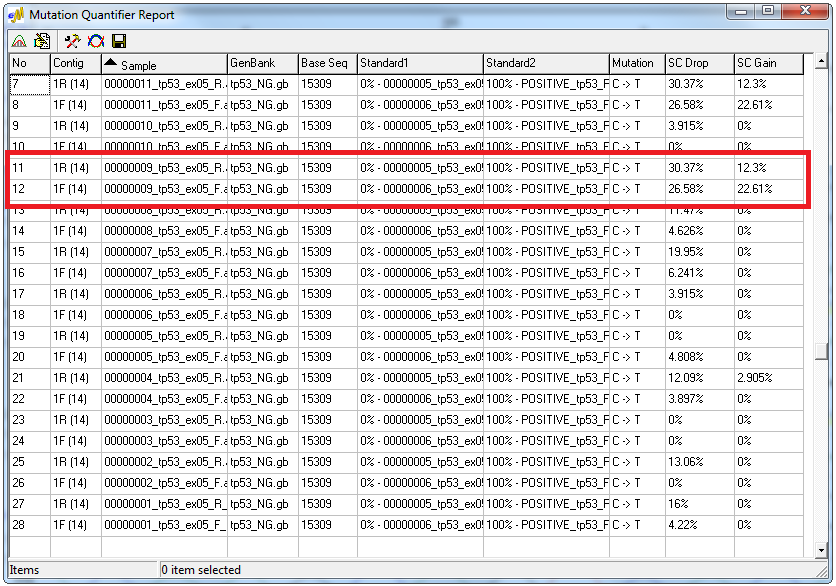
Figure 2: Standardized allele ratio report. SC Drop represents the percent decrease in intensity of the normal allele. SC Gain represents the percent increase of intensity for the mutant allele.
The nucleotide intensity patterns from peaks of the same color are essentially the same between samples run under the same experimental conditions. A mutation will cause a drop in intensity of the normal allele and a gain of intensity in the mutant allele. The Standardized Allele Ratio method calculates the percent decrease for the normal/wild-type allele and the percent increase of the mutant/novel allele for specific loci within sample files. The intensity ratio between two peaks of the same color in the same trace is used to quantify DNA mutations. Two standards are used to determine the percent gain and percent drop of the unknown: standard 1 (0% mutation) and standard 2 (Customizable %) mutation. Double-clicking on a mutation call within the Standardized Allele Ratio Report opens the Quantification Electropherogram window displaying the three traces used in the calculation.
Electropherogram Window of Standardized Allele Ratio Report Displays Sample Trace and Standards Used for Allele Quantification
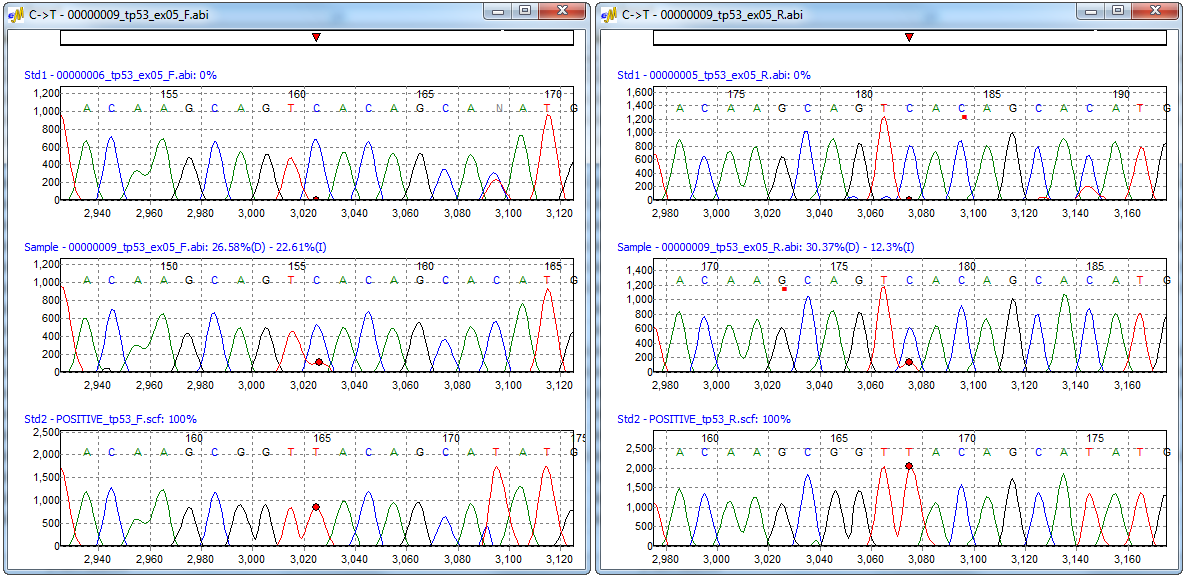
Figure 3: Quantification Electropherogram window for forward and reverse sample traces. Each window displays the three traces used for the quantification calculation: standard 1 (0% mutation), sample trace, and standard 2 (100% mutation).
Simplified Allele Ratio Calculates Peak Percentages from RFU
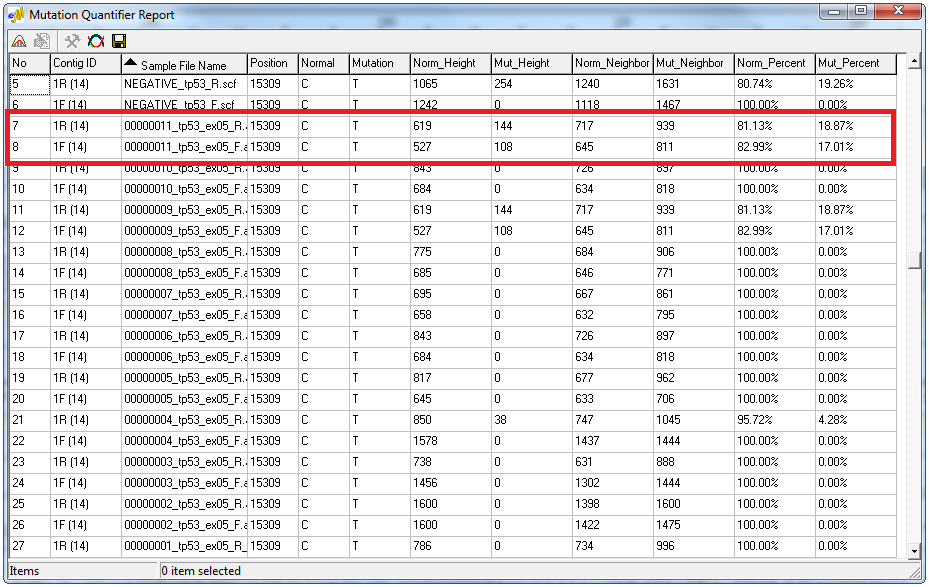
Figure 4: Simplified Allele Ratio Report - the forward and reverse traces of sample 11 contain 80% normal allele and 20% mutant allele.
The Simplified Allele Ratio option of the Mutation Quantifier calculates allele percentages from the signal intensity of major and minor peaks. The report displays RFU values for each allele as well as the percent contributed from each peak. Also included in the report is the average height of the closest four neighboring peaks that have the same color as the normal and mutant peaks. Double-clicking on a mutation call within the report opens an electropherogram window displaying the position within the sample file.
Simplified Allele Ratio Report Electropherogram Window Marks Mutant Allele with Red Dot

Figure 5:Electropherogram showing the mutant allele (T) under the normal allele (C). The mutant allele is marked with a red dot in the electropherogram.
Application Notes:
Webinars:
Trademarks property of their respective owner