Low-frequency DNA Variant discovery from Sanger Sequencing Traces
Mutation Surveyor software's patented “anti-correlation” technology provides the enhanced sensitivity needed for the detection of low frequency alleles in Sanger sequencing traces, including low-frequency variants associated with somatic mutations, heteroplasmy, and mosaicism. Many software packages, such as Thermo Fisher Scientific SeqScape®, Variant Reporter™, and Minor Variant Finder; DNAStar's SeqMan Pro™; Gene Code's Sequencher®; or JSI Medical Systems' SEQUENCE PILOT, rely on basecall differences and have been optimized for variant detection with alleles having heterozygous mixtures of 50%. However, today's sequencing projects demand software with an analytic sensitivity capable of detecting low frequency mutations that are often buried in background noise. Mutation Surveyor software provides a solution to these issues by offering a unique trace-to-trace comparison of sample sequence traces to a reference trace, calculating and displaying the physical differences between sample and reference peak in a mutation electropherogram. This technology has demonstrated accuracy in the bi-directional analysis mode over 99%, with sensitivity to greater than 5% of the primary peak. The sensitivity of the anti-correlation method has proven to be beneficial in the direct comparison of normal to cancer cells for the detection of somatic mutations in Sanger sequencing traces from all major capillary electrophoresis outputs.
Mutation Surveyor Software Detects Minor Alleles Buried in the Baseline
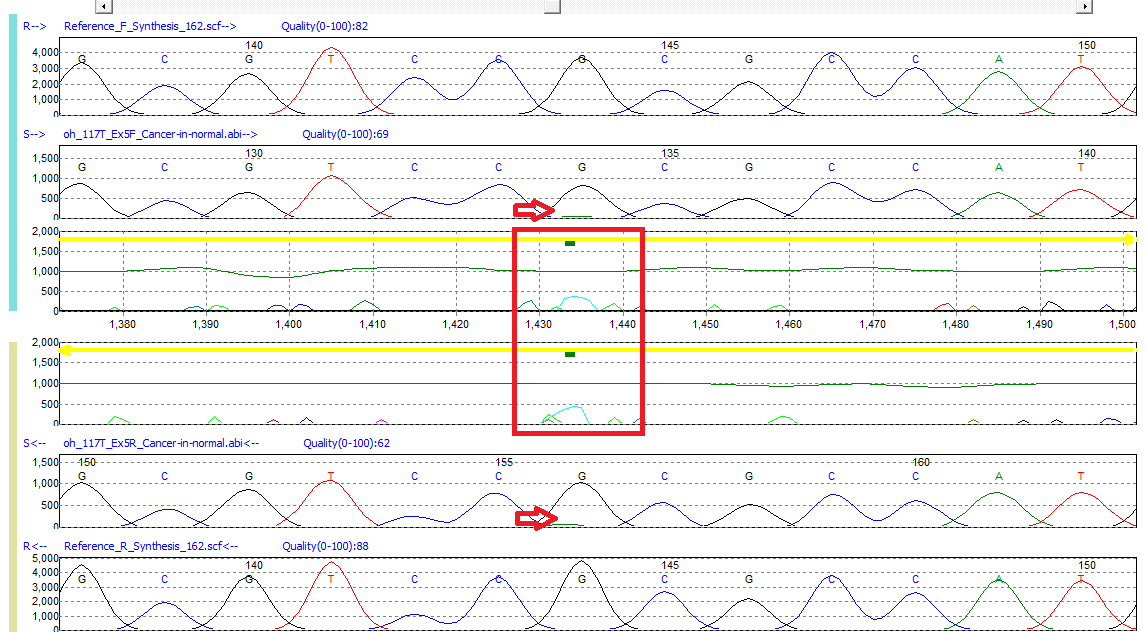
Figure 1: Low frequency G>GA mutation detected in Mutation Surveyor software. A green bar in the Mutation Electropherogram indicates the presence of a possible low frequency variant.
Mutation Surveyor software’s trace-to-trace anti-correlation technology evaluates physical characteristics of the sample trace relative to the reference, including: signal-to-noise ratio, overlapping factor, and dropping factor. Often somatic/low-frequency alleles do not result in major changes to the primary peak. However, Mutation Surveyor software’s sensitivity is capable of detecting these variants by monitoring minor mutation peak intensity calculated in the Mutation Electropherogram. When minor alleles of the same color are detected in both the paired forward and reverse directional trace files, Mutation Surveyor software places a green bar in the Mutation Electropherogram of the Graphical Analysis Display (GAD) at the location of event. The above image represents a low-frequency peak detected in exon 5 of the TP53 gene.
Mutation Quantification Tool Provides Major and Minor Peak Contribution
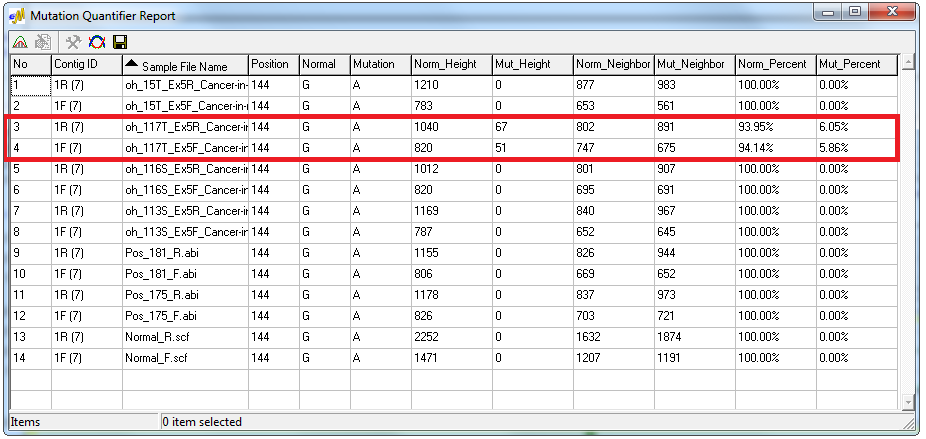
Figure 2: The Mutation Quantifier report displays the contribution from each allele. The low-frequency variant in this example has a minor/mutant peak contribution near 6% in both the forward and reverse trace.
The Mutation Quantification tool of the software automatically calculates the major and minor allele contribution through two methods. The Standardized Allele Ratio method provides the percent decrease in normal intensity and the percent increase in mutant intensity, and the Simplified Allele Ratio method uses Relative Fluorescence Units (RFU) to provide the relative percent contribution of the major and minor allele. The Simplified Allele Ratio report indicates that the low-frequency variants in this sample were detected with only 6% contribution of the primary peak.
Mutation Quantifier Tool Displays Major and Minor Allele in Electropherogram Window
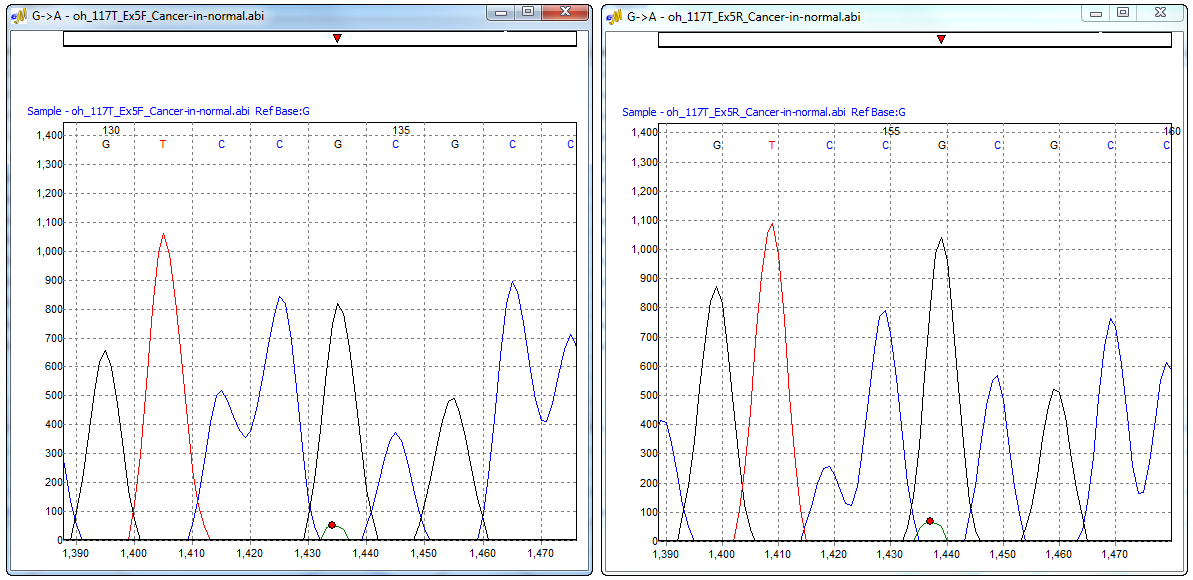
Figure 3: Electropherogram window displaying the major and minor allele of the forward and reverse trace. This window can be accessed from the Mutation Quantifier report, Simplified Allele Ratio method.
Flexible Reporting Options for Low-Frequency Variants
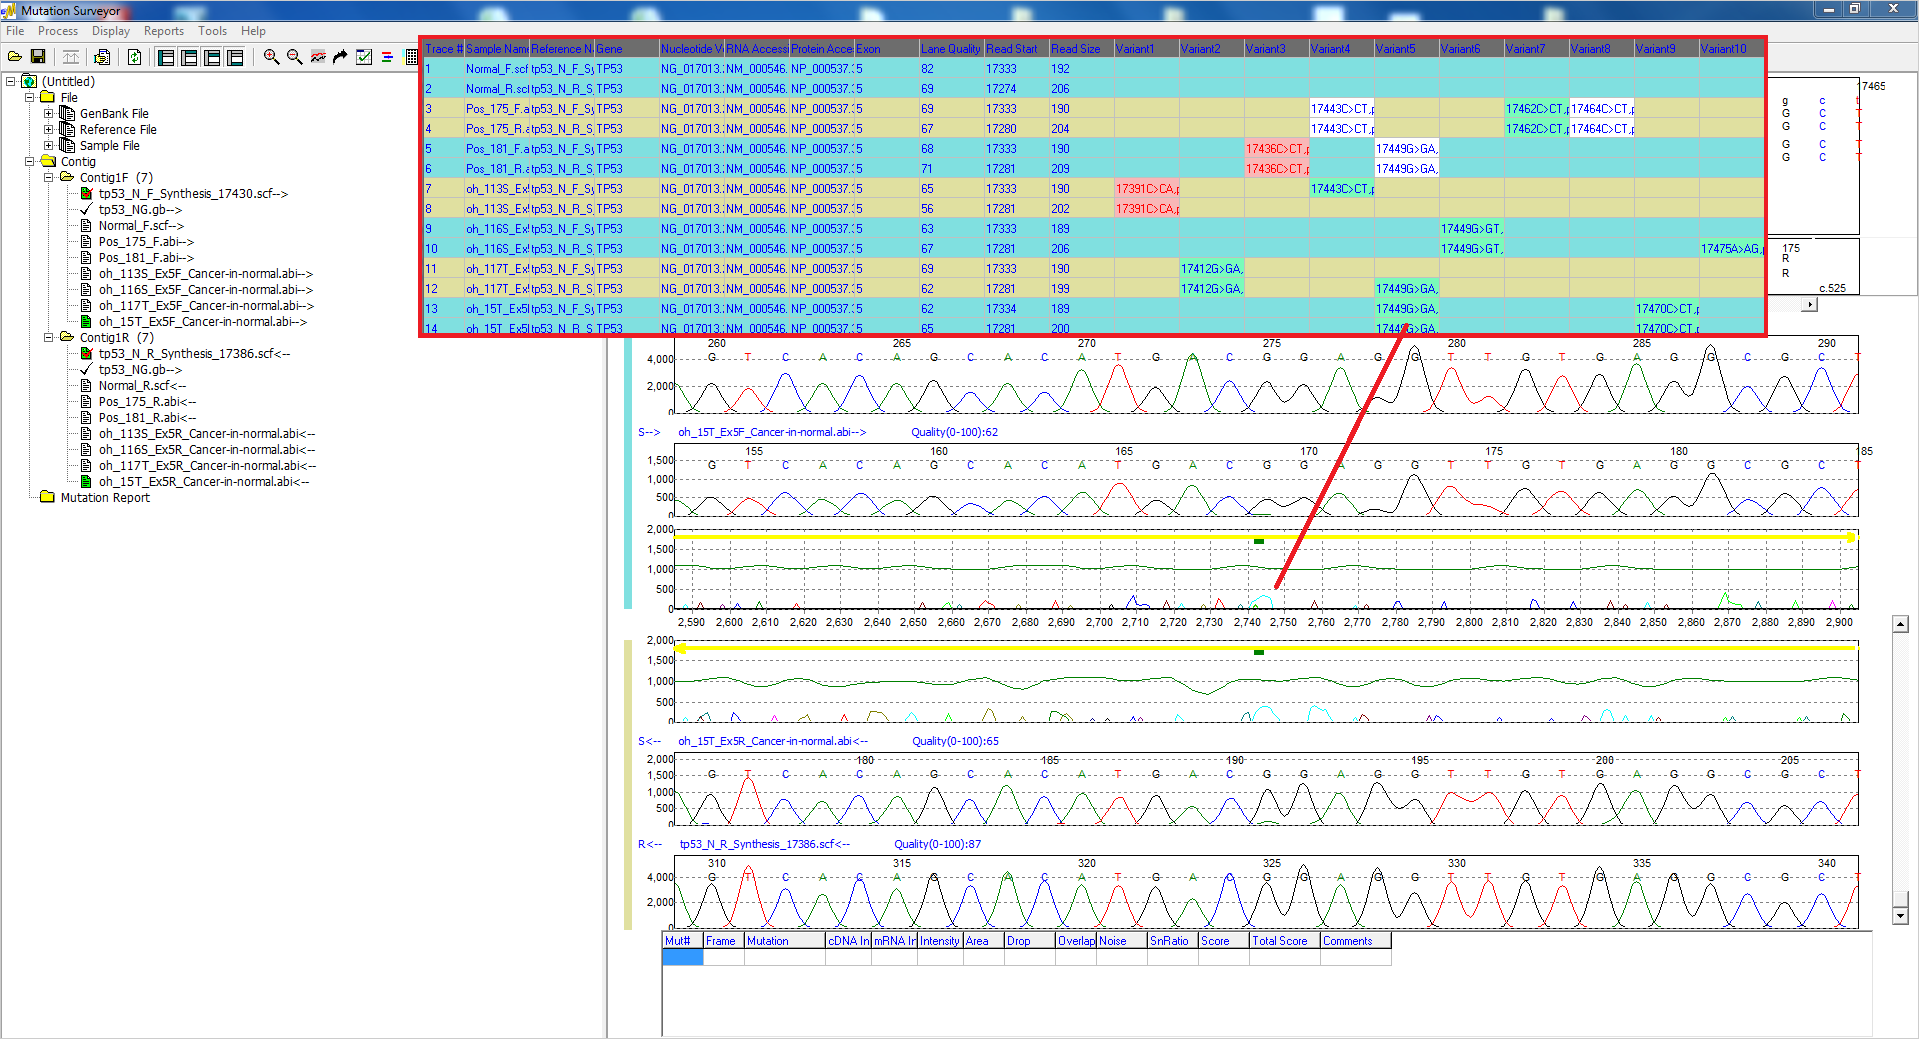
Figure 4: The Custom Report lists possible low-frequency mutations with a teal background. Custom color schemes can be added, and mutations can be edited with the click of a mouse.
The interactive reporting and display options of Mutation Surveyor software provide the flexibility needed for the user to make edits and to add, delete, or confirm low-frequency mutations in a number of ways. Rapid customization of reporting options also provides useful ways to identify low-frequency mutations, including background and text color-coding. Users can easily add mutations to the GAD at locations of possible somatic mutations and the Mutation Report will populate with the changes.
Additional details can be found on the Mutation Quantification page.
Application Notes:
Webinars:
- Optimizing Analysis Settings with Mutation Surveyor- Part 1
- Low Frequency Variant Detection in Mutation Surveyor
Trademarks property of their respective owner