Project Merge Tool: Merge Multiple Analyses into One Comprehensive Result for Improved Kinship, Population Genetics, Linkage, and Association Genetics Studies
Obtaining a complete genetic profile for wildlife and plant research or medical research is often complicated by overlapping marker ranges and/or incompatible chemistries; making it necessary to amplify the same samples multiple times using different sets of markers or locus specific primers. Traditionally, researchers export the genotyping results from several multiplexes into a spread sheet and manually combine allele calls for each individual.
GeneMarker® software is user-friendly genotyping software that automates this process with data from ABI®PRISM, Applied Biosystems SeqStudio™, and Promega Spectrum Compact CE genetic analyzers and custom primers. This merged report may be saved as a genome-wide genotype, or imported into other GeneMarker software applications, such as Clustering Analysis (automated dendrograms) or Relationship Testing and Kinship Analysis, improving the robustness of these analyses by including information from a greater number of markers.
The Merge Projects tool allows researchers to conveniently combine the results of two or more GeneMarker software projects (each project using a panel containing a unique set of markers or loci) into a single, comprehensive report. This report represents a single view of multiplexes (a super panel) of markers/loci from the individual projects, providing a complete genotype for each sample.
Merged Projects Example
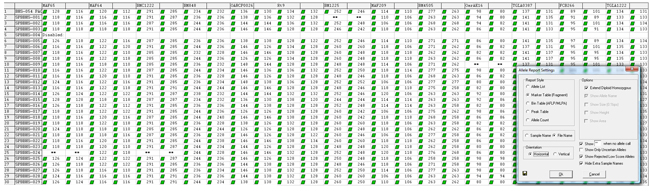
Figure 1: Three different multiplexes were used to amplify 30 DNA samples. Each multiplex contained primers for 4 or 5 independently assorting loci. The merge project tool in GeneMarker software provided a single genotype for each individual with 14 markers. Allele drop out is indicated by “**”.
Report style options include:
- Marker Table suitable for further analysis in Relationship Testing or Kinship Analysis
- Peak Table provides a spread sheet with marker and allele name, fragment size (MW), peak height, height ratio, peak area, area ratio
- Bin Table for further analysis using clustering algorithms for phylogeny.
Increased Discriminatory Power with Merged Genotypes
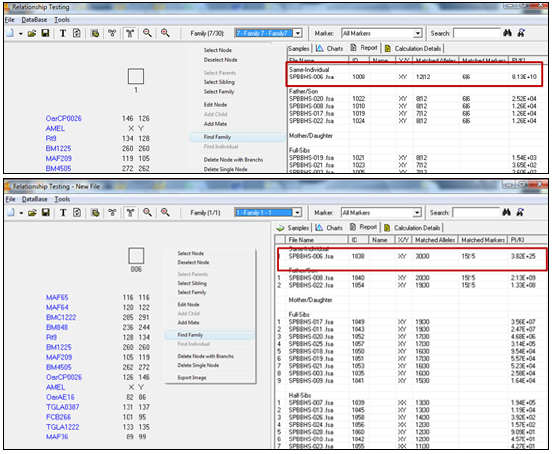
Figure 2: Is a comparison of a database search using the single multiplex results (5 independently assorting loci - upper figure) and the combined genotype (14 independently assorting loci - lower figure). The same file that had a 1/8.36 E10 probability that there would be another random individual in that population with the same genotype when 5 loci were used now has further confidence that this is not a second individual as the LR is 1/3.82 E25 when 14 loci are used in the IBD calculations. The additional loci have also refined the potential Father/Son files from four to two.
Refined Dendrograms using Merged Genotypes and Cluster Analysis
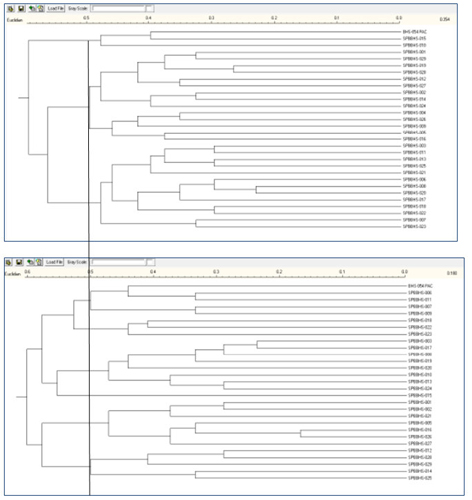
Figure 3: Information from the additional loci of the merged project provides a more informative dendrogram. Comparing the two dendrograms below, we see that there are three branches distinguished in the upper (5 loci) diagram and 8 for the same region of the dendrogram that utilized the 14 loci.
Application Notes:
Webinars:
MLPA® is the registered trademark of MRC Holland