MLPA® (Multiplex Ligation-dependent Probe Amplification) Analysis to detect and report copy number variations using GeneMarker Software
Multiplex Ligation-dependent Probe Amplification (MLPA) is a rapid, high-throughput technique for detecting copy number changes, with both general and clinical research applications. Kits are commercially available through MRC Holland. GeneMarker software provides an entire module dedicated to MLPA analysis in-house, no internet needed. The MLPA analysis application is linked directly to the program, allowing the user to process raw data, normalize samples, and perform MLPA analysis all in one program, eliminating unnecessary data transfers.
MLPA analysis with GeneMarker software is both rapid and accurate, allowing complete MLPA or MS-MLPA analysis of 96 samples in just minutes. GeneMarker software is compatible with outputs from all major sequencing systems, including ABI®PRISM, Applied Biosystems® SeqStudio™, and Promega Spectrum Compact genetic analyzers, as well as custom primers or commercially available chemistries. Analysts can access MLPA panels through GeneMarker software's panel editor, our website, or tech_support@softgenetics.com. GeneMarker software's MLPA application has been validated by research hospitals worldwide, is included in EuroGentest validation report, and is an excellent alternative to GeneMapper® and Coffalyser.Net Software.
Interested in Next Generation sequence analysis for MLPA? Click here information on analysis of MLPA data from Next Generation platforms such as Illumina or Ion Torrent and Download the application note NextGENe Batch CNV - MLPA Replacement (PDF)
GeneMarker software’s MLPA analysis screen comparing test samples (blue trace) to normal controls (red trace).
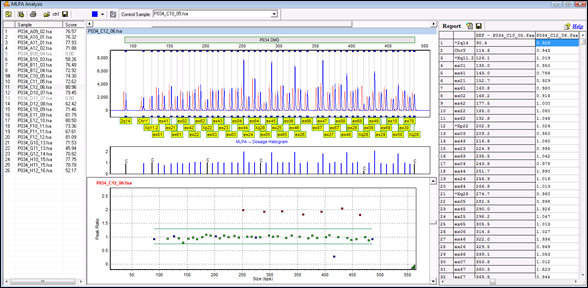
>The trace comparison (top, middle) shows a direct comparison between the selected sample and the reference. The resulting peak ratios are plotted in the ratio plot below, and are reported for each sample in the Report Table to the right. (In this example there is one heterozygous deletion, and seven homozygous duplications.)
Figures 1 – 11 provide details on the MLPA analysis workflow in GeneMarker software.
MLPA Normalization Increases the Accuracy and Consistency of Analysis
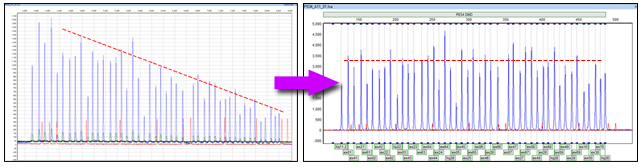
Figure 1: GeneMarker software gives users two methods of data normalization. Control Probe Normalization uses the internal control probes to normalize peak heights (recommended by MRC Holland for most chemistries); whereas Population Normalization uses all probes in a sample to normalize peak heights (recommended for chemistries that do not have internal control probes throughout the main marker for the kit. Both methods improve the linearity of the data, allowing more accurate and consistent results.
Automated Quality Control Increases Rigor and Efficiency
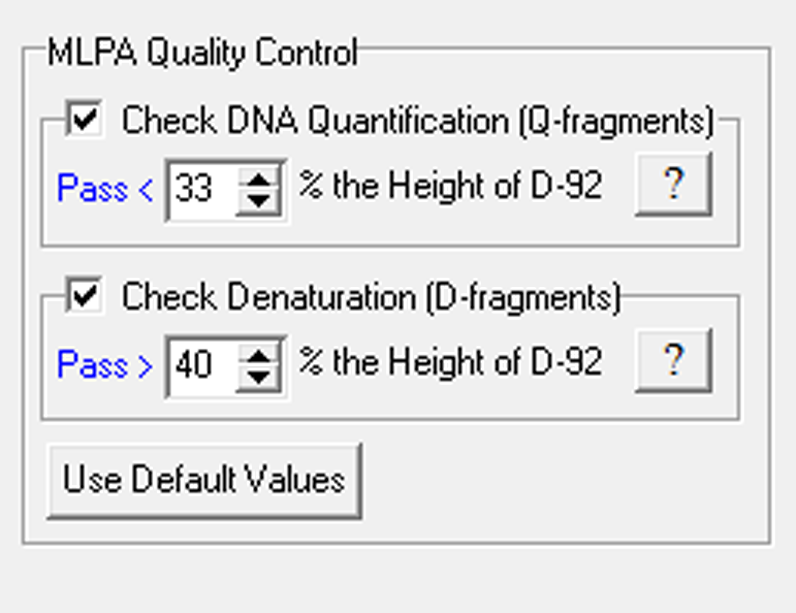
Figure 2: The Quality Control Settings are automatically turned on when the MLPA template is selected. The program will alert the user if one or more of the Quality Control Settings are turned off (as shown in Figure 3).
Quality Control Settings Alert

Figure 3: The program automatically detects important quality control fragments within each sample, and alerts the user if the behavior of any fragment is outside of the norms recommended by MRC Holland. These settings help make quality control easier and more rigorous.
Automated Detection and Repair of Saturated Peaks
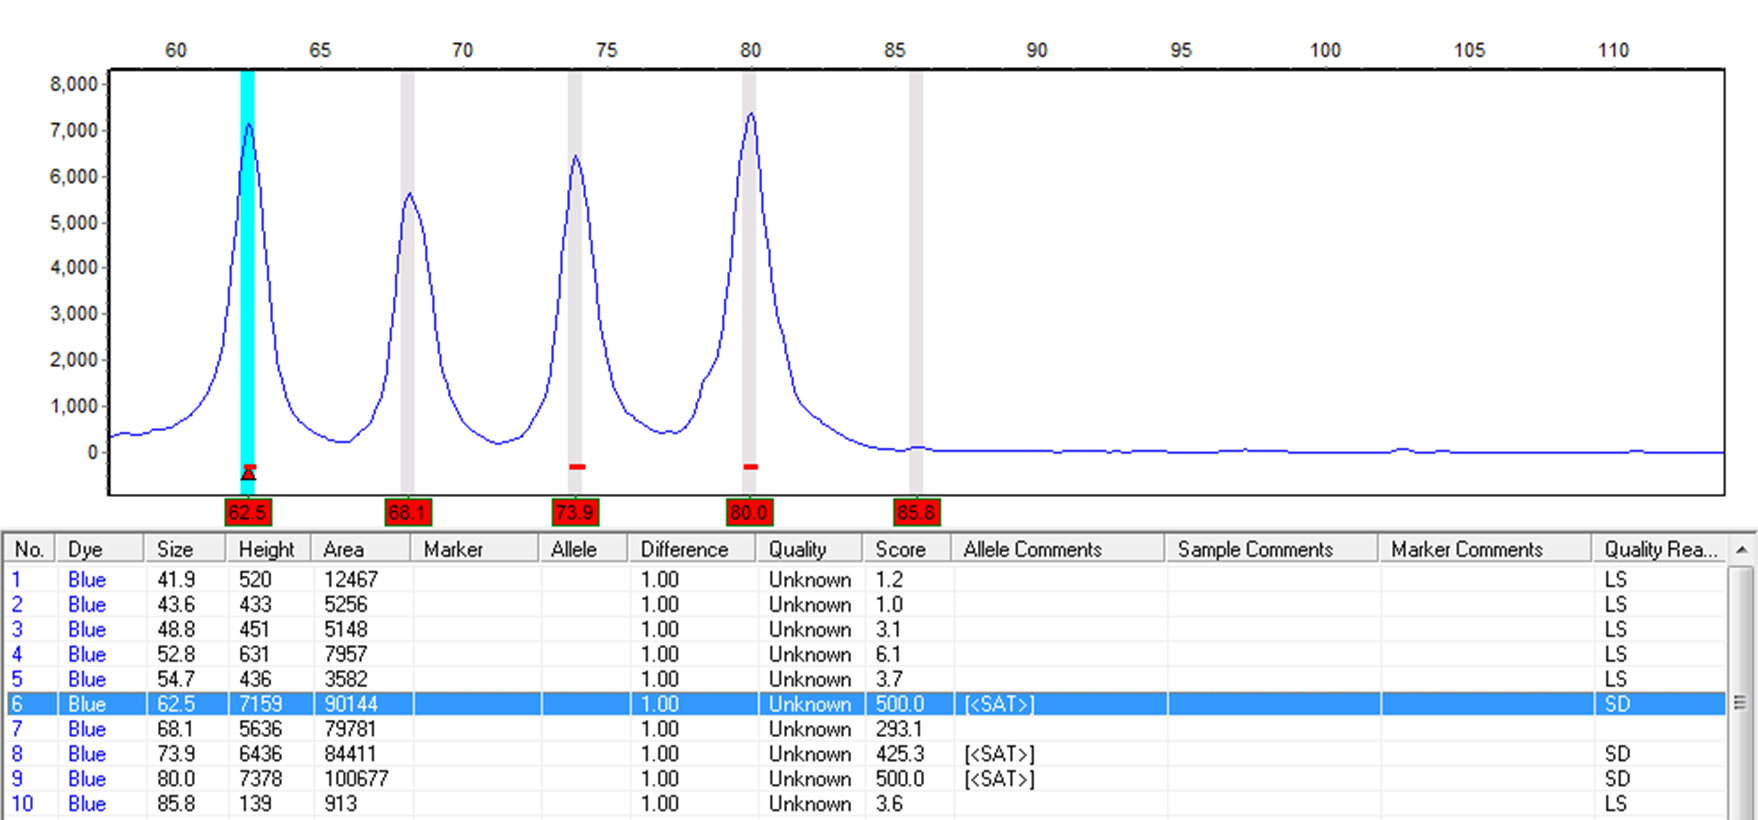
Figure 4: Saturation Detection (SD) will detect saturated peaks. The detected peak will be given the Quality Reason, SD, and a red underscore at the corresponding location on the electropherogram. Saturated and Saturated/Repaired peaks are not recommended for any quantitative calculations and will result in a pop-up warning message.
Additional Quality Warnings for Analysts moving to Post-genotyping Applications
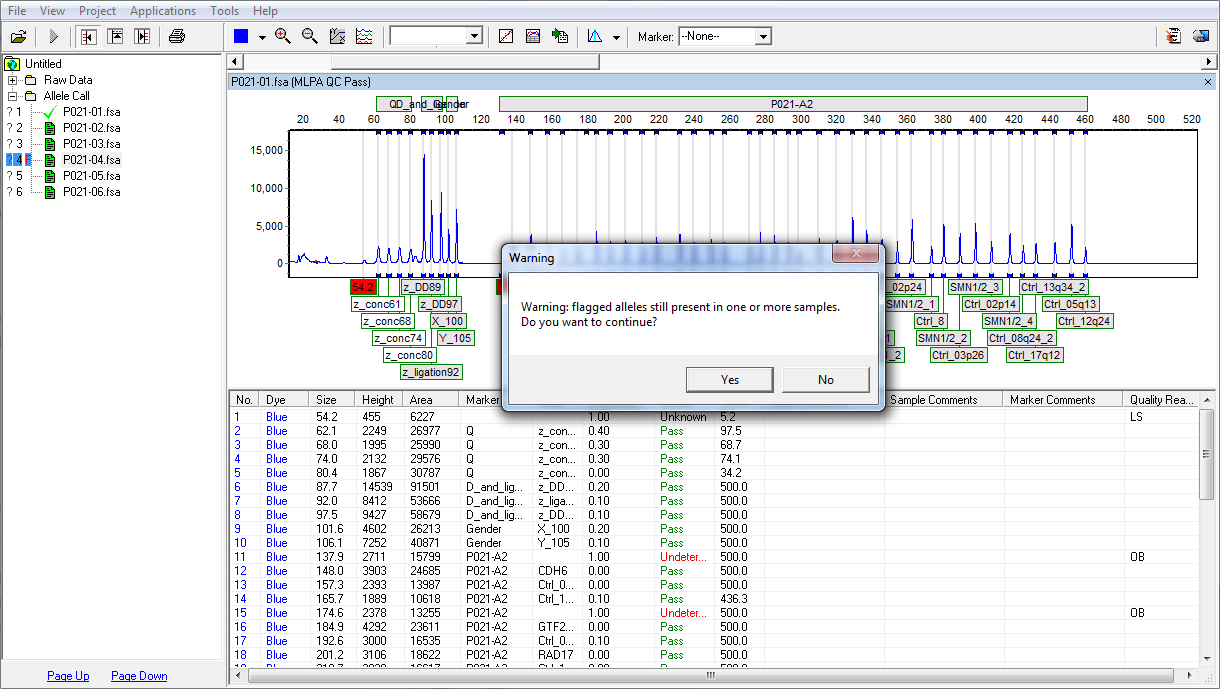
Figure 5: If there are flagged alleles present in one or more of the samples, the program will warn the user when attempting to access a Post-genotyping Application before the flags are resolved. This setting can be turned on/off under View Preferences.
Detailed Reports Ensure Results are Communicated Clearly and Effectively
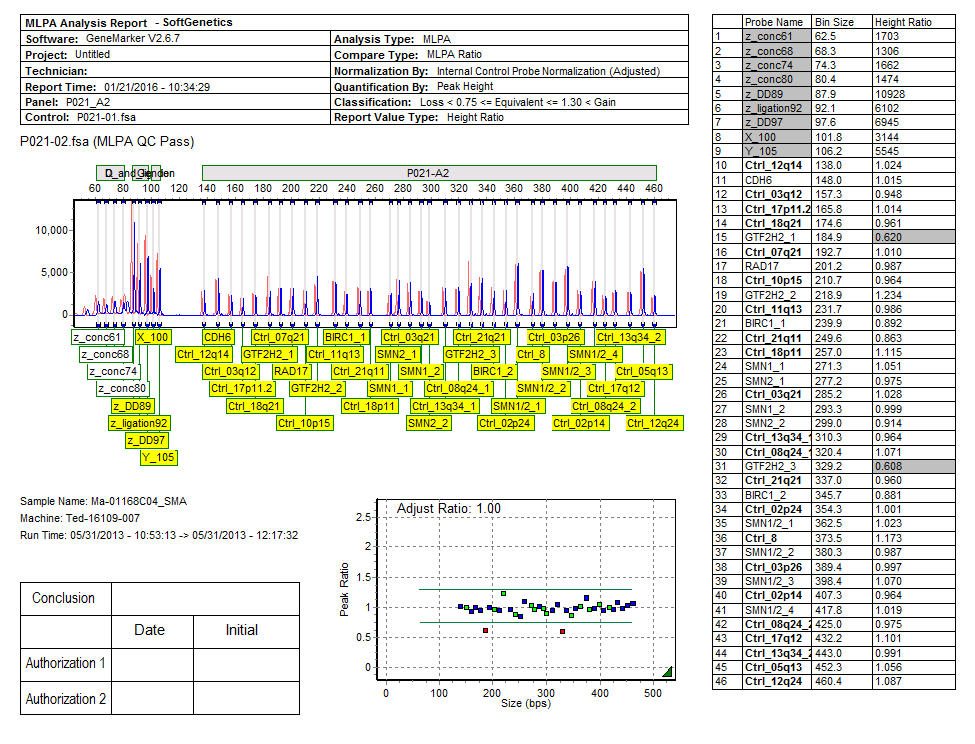
Figure 6: Reports include an informative header, electropherogram, ratio plot, validation box, and report table. They can be customized to display the entire sample, a particular peak, or clusters of peaks
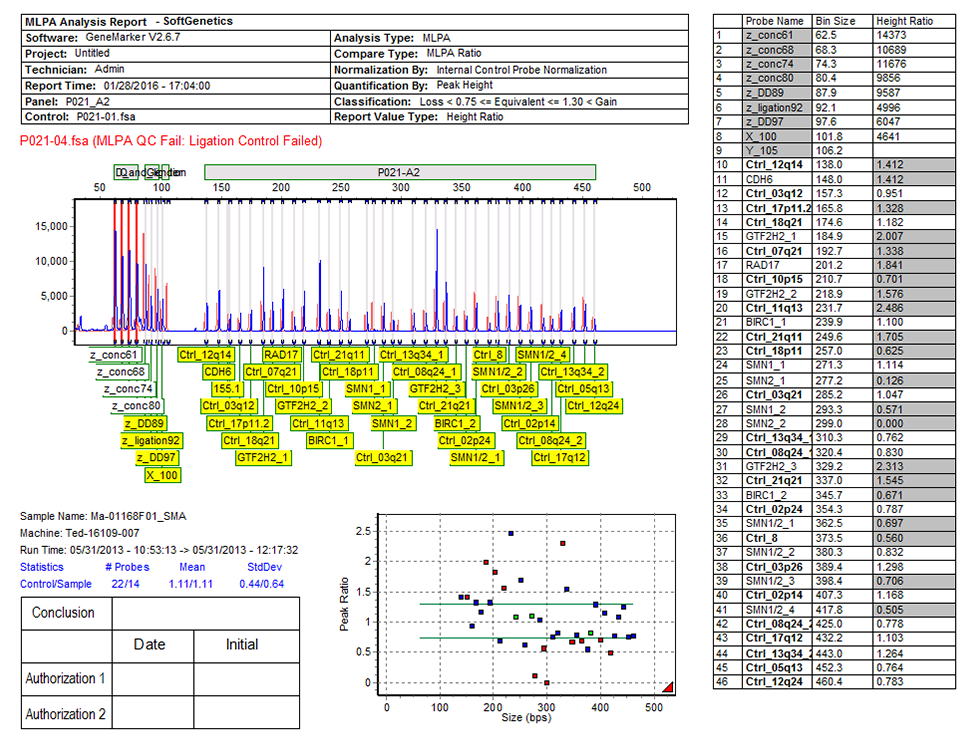
Figure 7: When the Automated Quality Control Settings are used, the final report will denote whether the Quality Control Fragments passed or failed. If the Quality Control Fragments do not pass, a failed message will be shown in red font on the final report. Reports may be printed directly, or electronically saved in .PDF, .PNG, or .JPEG formats.
Highlight Probes of Interest
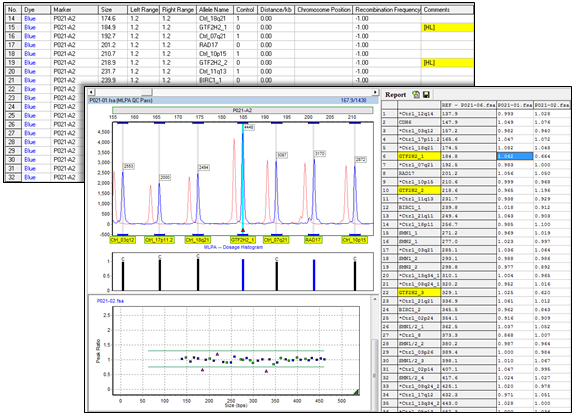
Figure 8: Highlighting helps draw attention to probes of particular interest. These probes will also be displayed as triangles in the ratio plot. Highlighting may be included in the print reports as well.
Easily Customize your Analysis Settings
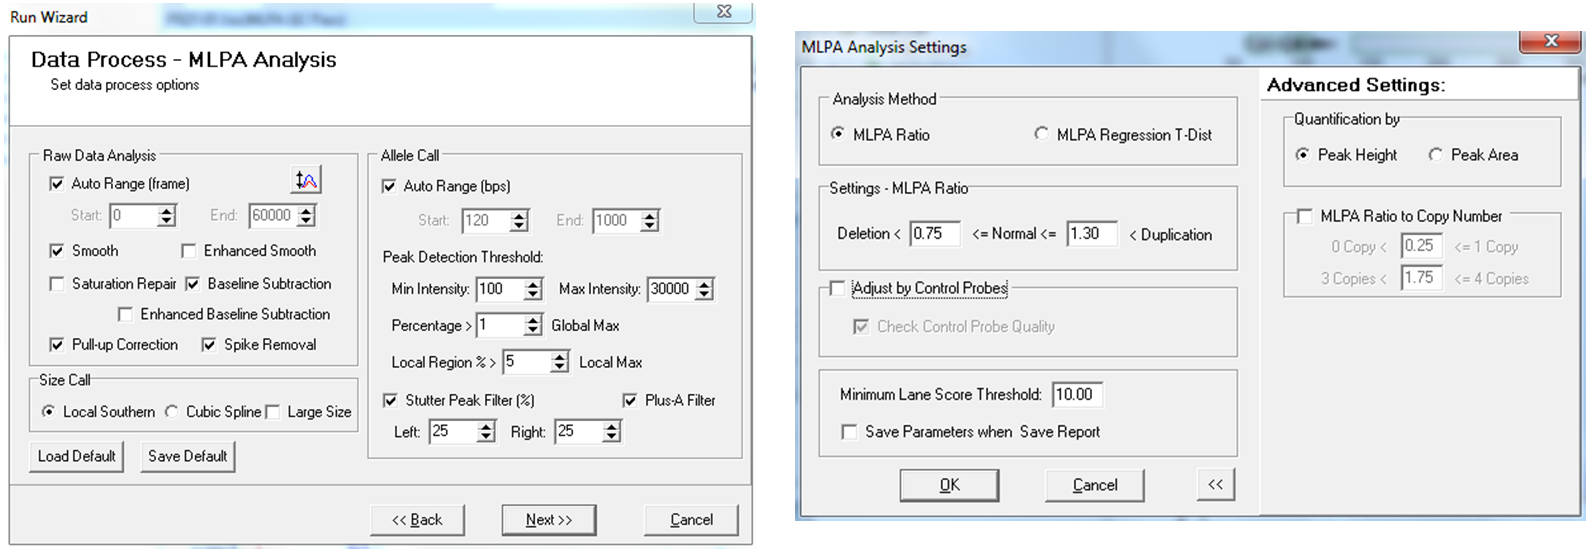
Figure 9: GeneMarker allows for easy customization of analysis settings. Users can also proceed directly to the analysis using the recommended defaults.
Use Templates to Save Settings for Commonly Used Chemistries

Figure 10: Analysis settings can be saved in templates, reducing clicks and increasing the speed of analysis.
Share Panels, Size Standards, and Template Files Over Your Network
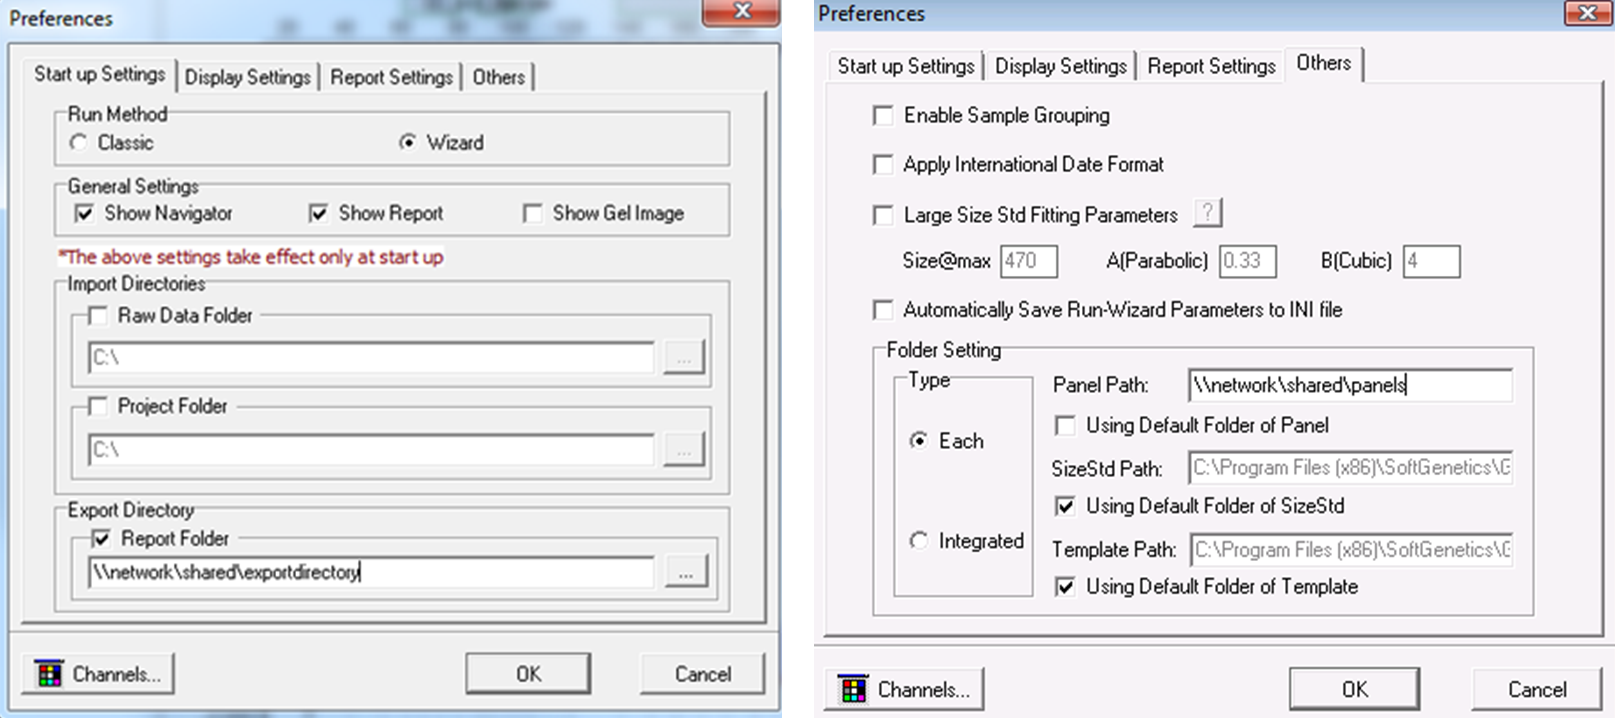
Figure 11: The working directories for panels, size standards, and templates may be changed, allowing these files to be easily updated, saved, shared, and distributed over a network. An export directory may be set in order to save all reports to a common location.
Application Notes:
Webinars:
MLPA is registered trademark of MRC Holland