TILLING® and EcoTILLING Analysis for detection of Single Nucleotide Polymorphisms (SNPs) with GeneMarker software
TILLING and EcoTILLING have been widely used since 2000 to detect Single Nucleotide Polymorphisms (SNPs) in organisms ranging from Arabidopsis to zebra fish. The test samples may be experimentally mutagenized (ethylmethanesulfonate, radiation, etc.), from natural populations or derived from tumors or diseased tissues. The genes of interest are identified with gene-specific primers and PCR amplified. The amplicon's primers are labeled with two fluorescent dyes; the forward is often labeled with FAM-blue and the reverse primer is often labeled with HEX-green. The samples are mixed so heteroduplexes can be formed. The hybridized fragments are cleaved at the heteroduplex site by CEL I or Surveyor™ Nuclease, generating multiple pairs of fragments of complementary length and dye color. The denatured samples can be run through gel electrophoresis or mixed with an internal size standard and run through capillary electrophoresis. SNPs will yield two peaks of different color and the sum of the sizes will equal the amplicon length.
The linked TILLING analysis module uses data analyzed with GeneMarker software's accurate Size Calling algorithms and customized Run Wizard, allowing it to provide rapid analysis of raw data from ABI®PRISM, Applied Biosystems® SeqStudio or Promega Spectrum Compact CE Systems genetic analyzers, and custom primers. When using GeneMarker software's Tilling Application module, the size standard peaks are identified and all sample peaks are aligned. The peaks are smoothed, the baseline is subtracted, and the lane intensities are normalized. Low-quality data is automatically rejected. A synthetic reference trace (Synthetic Control Sample) is constructed using median peak intensities from all of the high- quality traces. This reference is subtracted from each sample trace generating a Mutation Chart that automatically identifies the sample's variations as shown in figure with the amplicon length of 1049bps.
GeneMarker software TILLING Analysis
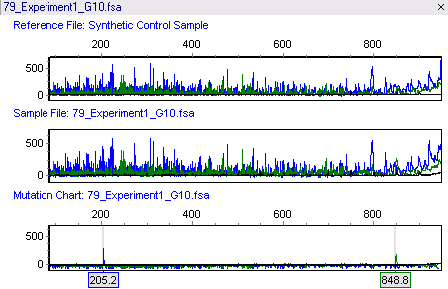
Figure 1: The top panel shows the Synthetic Control Sample obtained from the median intensity after peak alignment. The middle panel shows sample 79. The bottom panel shows the Mutation Chart, generated by subtracting the reference from the sample, and identifies individual variations. A blue peak at 205.2bps and a green peak at 848.8bps have been automatically identified. The original amplicon size is 1049bps.
Application Notes:
MLPA® is the registered trademark of MRC Holland