Analysis and Calculation of Repeat Number for Repeat Expansion Diseases, including: Huntington’s (HTT), Amyotrophic Lateral Sclerosis/Frontotemporal Dementia (ALS, C9ORF72) and Dystrophia Myotonic Protein Kinase (DMPK)
Expansions of simple sequence repeats, mainly but not limited to tri-nucleotide repeats, are responsible for over 40 human diseases. In general, an increasing number of repeats results in more severe phenotype and the number of repeats increase (expand) as the disease gene is inherited.
The Repeat Expansion Application in GeneMarker software is linked to the main analysis window (Figure 1) performs repetitive calculations; converting fragment size to repeat length. Analysis parameters and report format are easily customized to fit the SOP for the laboratory (Figure 2). Mobility coefficients are automatically calculated from calibrator samples of known repeat fragments, or entered manually from the laboratory validation studies (Figure 3). Reporting options include .xls, .txt files of result tables and .pdf, .png, .jpg (.jpeg) image files of individual sample reports, and project summary reports (Figures 4-6).
GeneMarker software is compatible with data from Asuragen®-AmplideX® repeat expansion or custom chemistries, output files from all major capillary electrophoresis instruments and Windows® 7 – 10 OS, for rapid and accurate analysis.
See Figures 1 – 6 for an overview of the Repeat Expansion Application:
- No data transfer - reduces errors and analysis time
- Accurate Calculation of Number of Repeats – Increases accuracy and speed of analysis
o Using calibrator/known samples or lab entered coefficients - Customize analysis templates to meet lab SOP – lock in templates for consistent workflow
Embedded Application – No spread sheets or macros needed
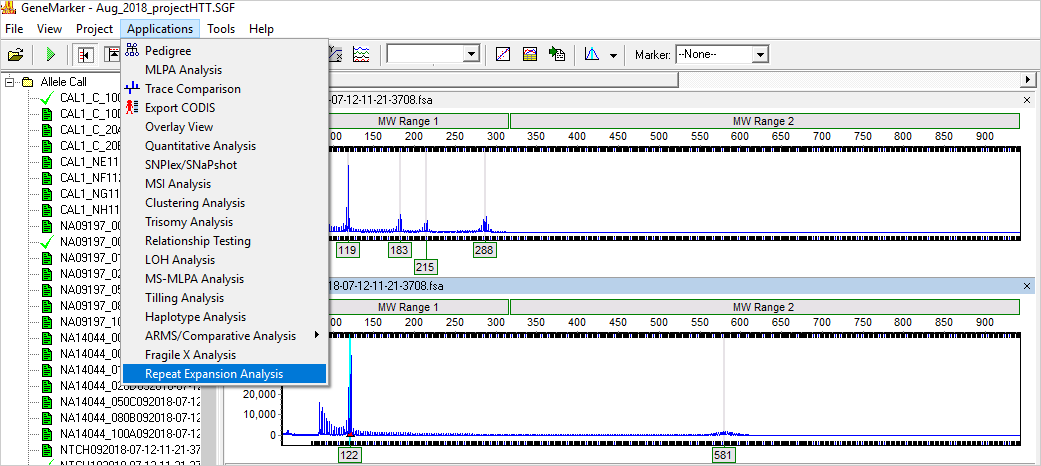
Figure 1: Link directly to the Repeat Expansion Analysis from the main genotyping screen; removes error-prone transfer to spread sheets for calculation of repeats.
Customize analysis to meet standard laboratory operating procedures
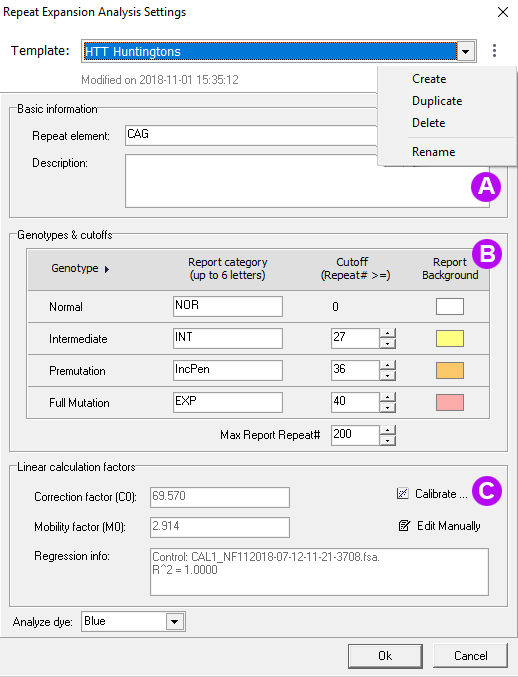
Figure 2: (A) Select an existing template or create a new template. (B) Specify the repeat category, cutoff values and if desired, report highlighting colors. (C) Use a calibrator sample to calculate correction coefficients or enter the lab-determined values.
Review the Results
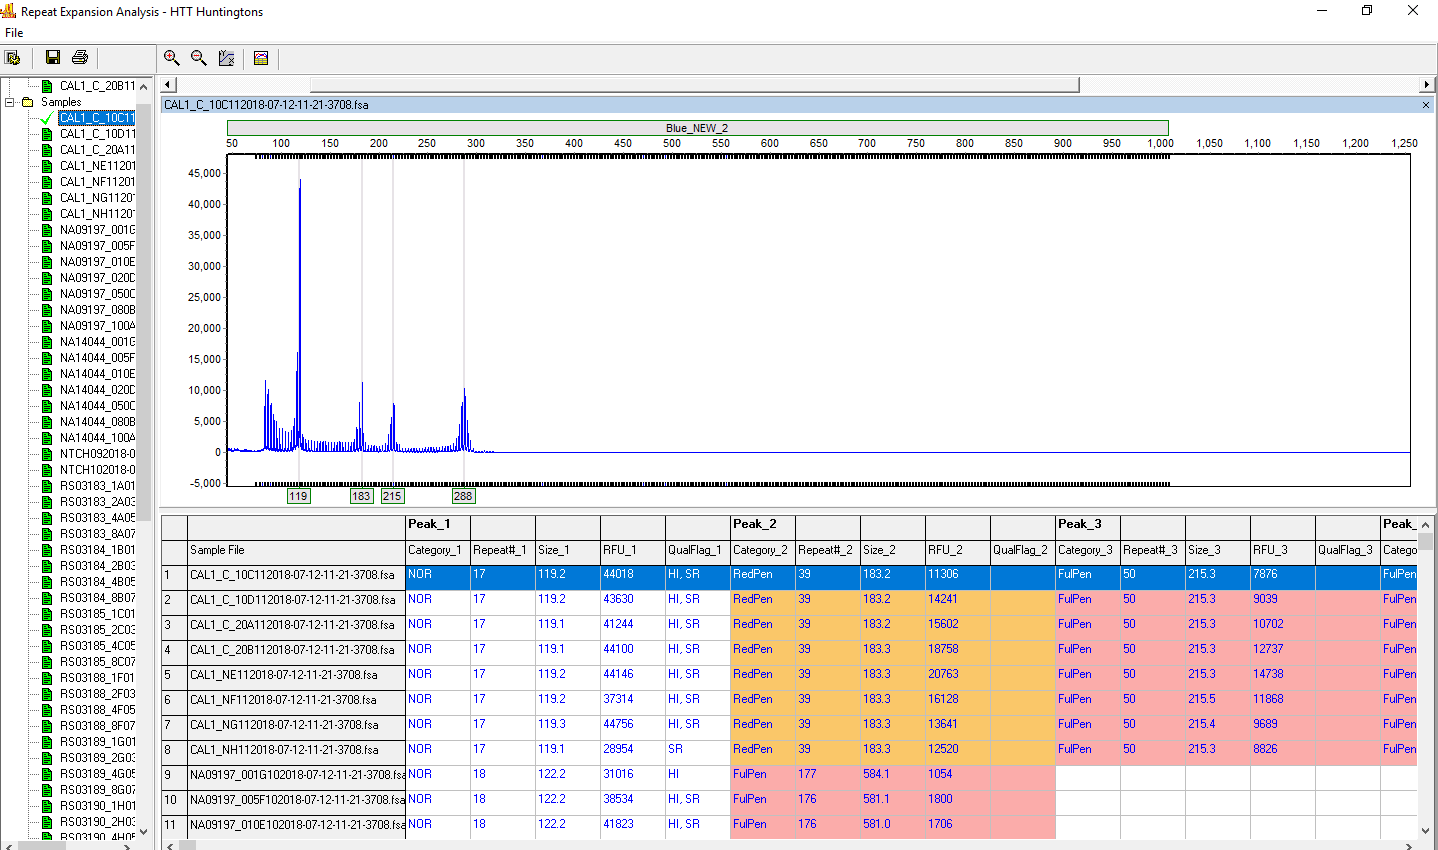
Figure 3: The calibrator sample is displayed in the upper left of the screen. All samples are listed at the left. Select a sample to review the electropherogram and result table. Right-click on the result table to remove any columns that are not needed for laboratory reporting requirements. Use the save icon to save a table (.xls, .txt) of the results.
Generate Report -- Save reports as image files (pdf, png, jpg), .txt tables or print.
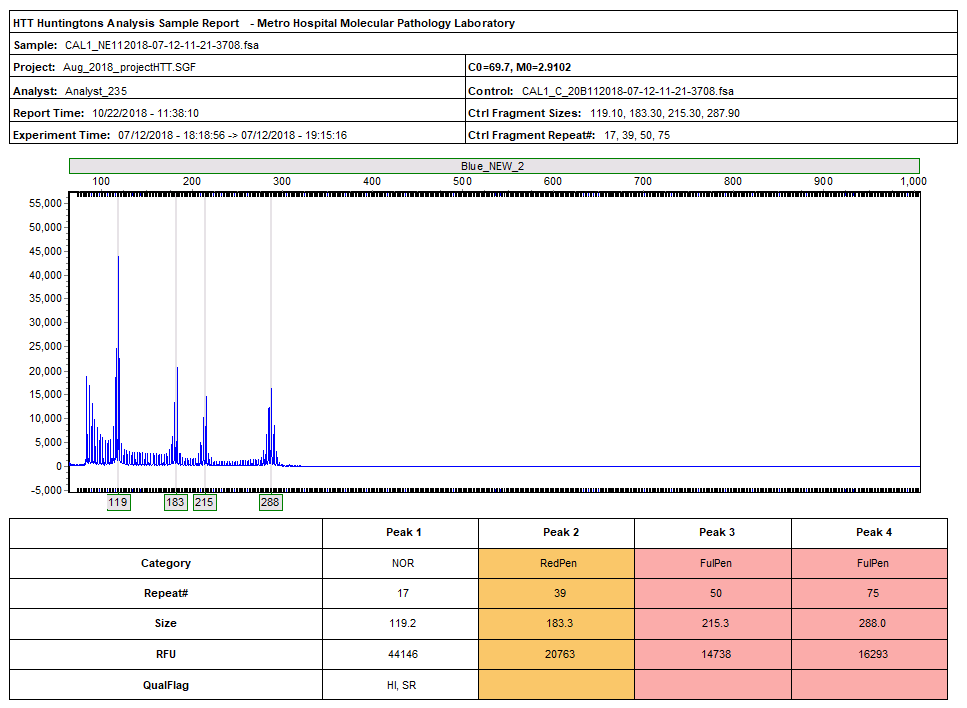
Figure 4: Individual reports are generated for each file. The report includes: a header with laboratory, analysis and sample information, along with the electropherogram and report table.
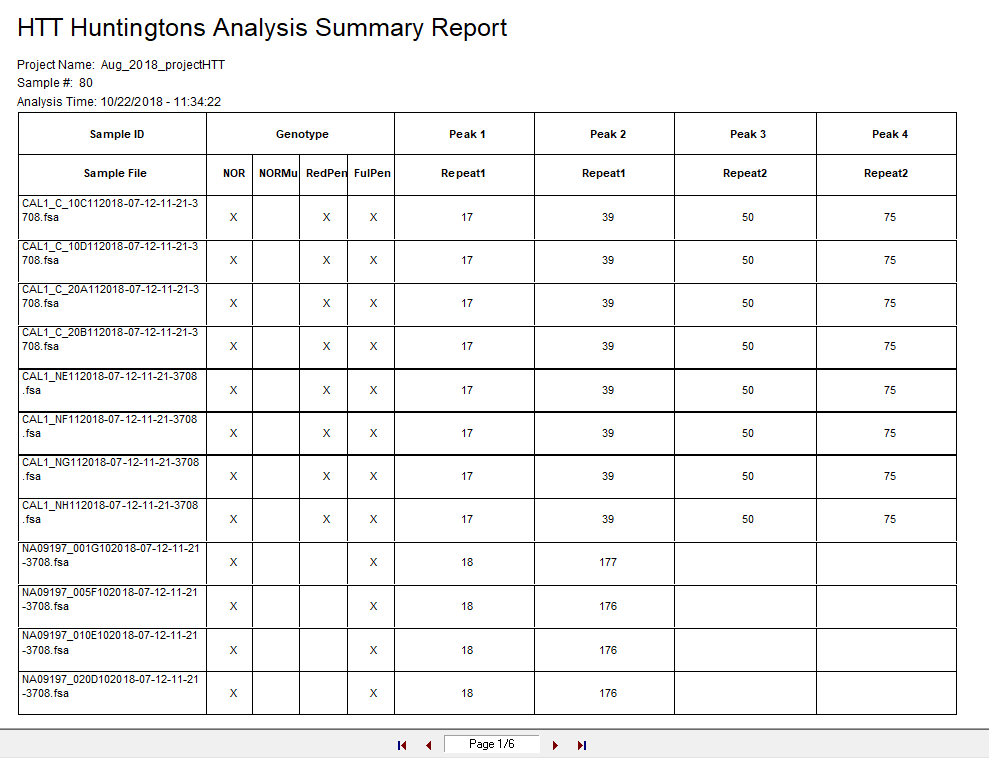
Figure 5: The summary report is titled according to the analysis template name and provides a summary table with the Genotype category and calculated repeats of fragments in each sample of the project.
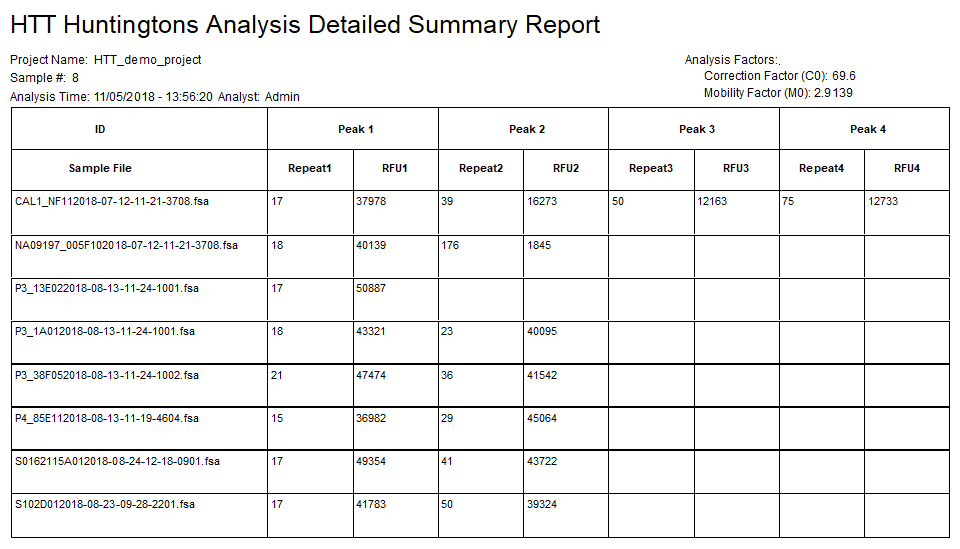
Figure 6: The detailed summary report includes the calculated repeat number(s) and peak height(s) for each sample in the project.
Acknowledgements
Our sincere thanks to the following research scientists for helpful conversations during development of the repeat expansion application: Pamela Snyder (Ohio State University), Ty Lynnes (Indiana University School of Medicine), Michelle Axford (North York General Hospital), and to Robyn Cardwell, Brad Hall, Ninad Pense, Charles Redmond and Sarah Statt (Asuragen Corporation) for helpful discussion and supplying data used in development of the application.
Application Notes:
MLPA® is the registered trademark of MRC Holland