Trisomy Analysis
GeneMarker® software is a great, biologist-friendly tool for aneuploidy abnormality detection and analysis. Aneuploidy occurs from non-disjunction during meiosis I or meiosis II during gametogenesis and results in an abnormal number of chromosomes in the gametes. This abnormality results in trisomy or monosomy. Most common forms of trisomy involve trisomy of chromosome 21 (Down Syndrome), others include: trisomy 18 (Edwards Syndrome), and trisomy 13 (Patau Syndrome). Aneuploidy of sex chromosomes may result in extra X chromosome(s) - known as Klinefelter syndrome for men and Triple X syndrome for women - while monosomy X gives rise to women with Turner syndrome. GeneMarker software provides accurate size and allele calls with a linked trisomy application for complete data analysis from QF-PCR results Aneufast, CyberGene®, Devyser®, Elucigene QST*R® kits or custom-chemistries. The program's Customized report follows Best Practice Guidelines. Users can also automate MCC testing prior to aneuploidy or trisomy analysis with ChimeRMarker® software. GeneMarker software accepts all major CE output files, including ABI®PRISM, Applied Biosystems® SeqStudio, and Spectrum Compact CE System genetic analyzers, as well as custom primers or commercially available 4-6 dye chemistries. The biologist-friendly software is an excellent alternative to: Applied BioSystems GeneMapper® software.
GeneMarker software has been designed to accurately detect trisomy using short tandem repeat markers derived from PCR DNA fragments. The linked application removes error prone data transfer steps.
Review GeneMarker® Aneuploidy/Trisomy Analysis Webinar
- Use of peak height or peak area ratios
- Identification of peak ratios that are consistent with designated triallelic (trisomy) range
- Identification of peak ratios that are consistent with intermediate (inconclusive) ranges
- Linear correction of data to resolve PCR bias
- Display of ratio plots for population or individual sample
- Conclusion/Authorization table
- Header automatically populated with info on sample ID, analysis parameters and analyst name/affiliation
Trisomy Analysis Report
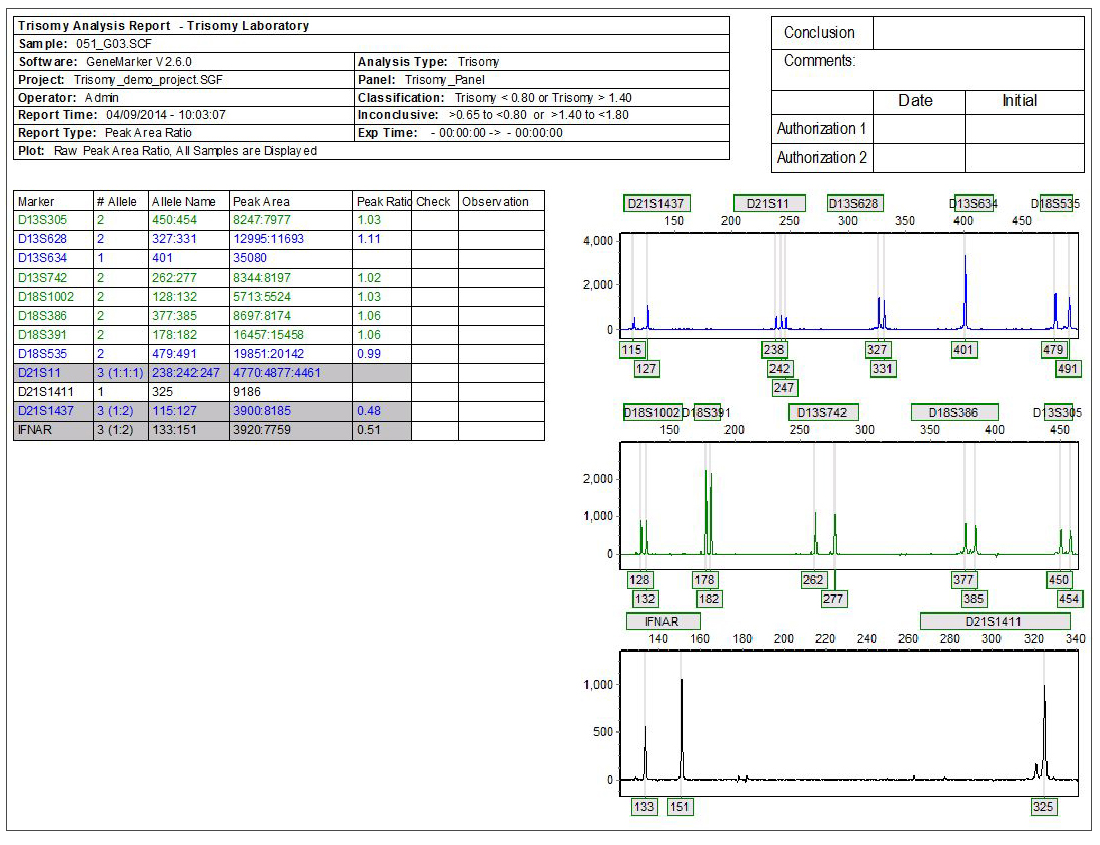
Figure 1: Individual Report: Highlighted samples are consistent with user specified triallelic range and samples marked with a ‘?' are consistent with user specified intermediate (inconclusive) ranges.
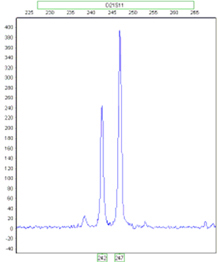
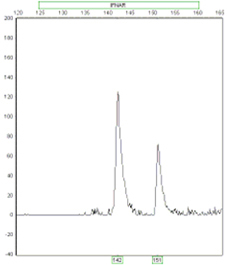
Detecting Trisomic Ratios: Trisomy individuals will either show three fragments of equal intensity or two fragments at a 2:1 or 1:2 ratio.
Ratio 1:2
Ratio 2:1
Ratio 1:1:1
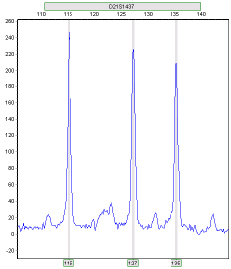
Figure 2: GeneMarker software’s Trisomy tool offers two answers to the 2:1 trisomy detection question. First, in the Ratio Plot, the peak intensity ratio of each marker is plotted. A linear regression line is run through the center of the data points and is used to correct for intensity drop due to fragment size increase. The Ratio Plot can be viewed as a linear regression plot or corrected for slope. This method of data correction aids in the detection of 2:1 ratio trisomies when the inconclusive range is not selected.
Report option with ratio plots corrected for slope if the lab opts to forgo the inconclusive range parameter for two-peak trisomy detection

Figure 3: The second aid in trisomy determination is the trisomy score and peak ratio plots. First a t-value is determined and defined as the difference between the sample and the expected value divided by the standard deviation. There are two possible t-values for every marker: one is the t-value for heterozygote and the second is for a trisomy. T-Score is the ratio of the heterozygote t-value divided by the trisomy t-value. Therefore, as the T-Score increases, the confidence of the trisomy call also increases. A T-Score greater than 5.0 is a confident trisomy call. A T-Score less than 0.3 indicates a confident heterozygous call.
Application Notes:
Webinars:
MLPA® is the registered trademark of MRC Holland