Microsatellite Analysis (SSR, STR, VNTR) with Embedded Pedigree Functionality
Microsatellites (also known as simple-sequence-repeats, simple-tandem-repeats, variable-nucleotide-tandem-repeats in eukaryote research, or Multiple-Loci-VNTR-Analysis in microbial research) are widely used to determine the genotype of organisms based on naturally occurring variation. With eukaryotes, the genotypes are used in areas like population genetics, forensics, agriculture advancement. With bacteria and other microbes, MLVA is used for population genetics, to study transmission routes, sources of infection and the impact of vaccination and use of antibiotics on antibiotic resistance.
GeneMarker software decreases analysis set-up time, in comparison to GeneMapper® software through automated correction of common genotyping problems including saturated and pull-up peaks, instrument spikes, and stutter peaks. A flexible panel editor provides custom panels required for microsatellite analysis, and the software's automated Run Wizard is designed to make analysis quick, easy, and accurate.
GeneMarker software is compatible with outputs from all major sequencing systems, including ABI®PRISM, Applied Biosystems® SeqStudio and Spectrum Compact CE genetic analyzers, as well as custom primers or commercially available 4-6 dye chemistries.
GeneMarker software is equipped with several data processing options that make Microsatellite analysis more accurate:
- Saturation Correction: Analysis of saturated data points by creating a synthetic peak based upon the peak shape before and after saturation.
- Baseline Subtraction: The software removes the baseline so that the Y axis is above the noise level.
- Pull-up Correction: This function removes peaks caused by wavelength bleeding.
- Spike Correction: The software automatically removes peaks from voltage spikes caused by micro- air bubbles or debris in the laser path.
- Stutter Peak Correction: The software automatically filters for stutter peaks caused by PCR slippage.
Microsatellite Analysis Results
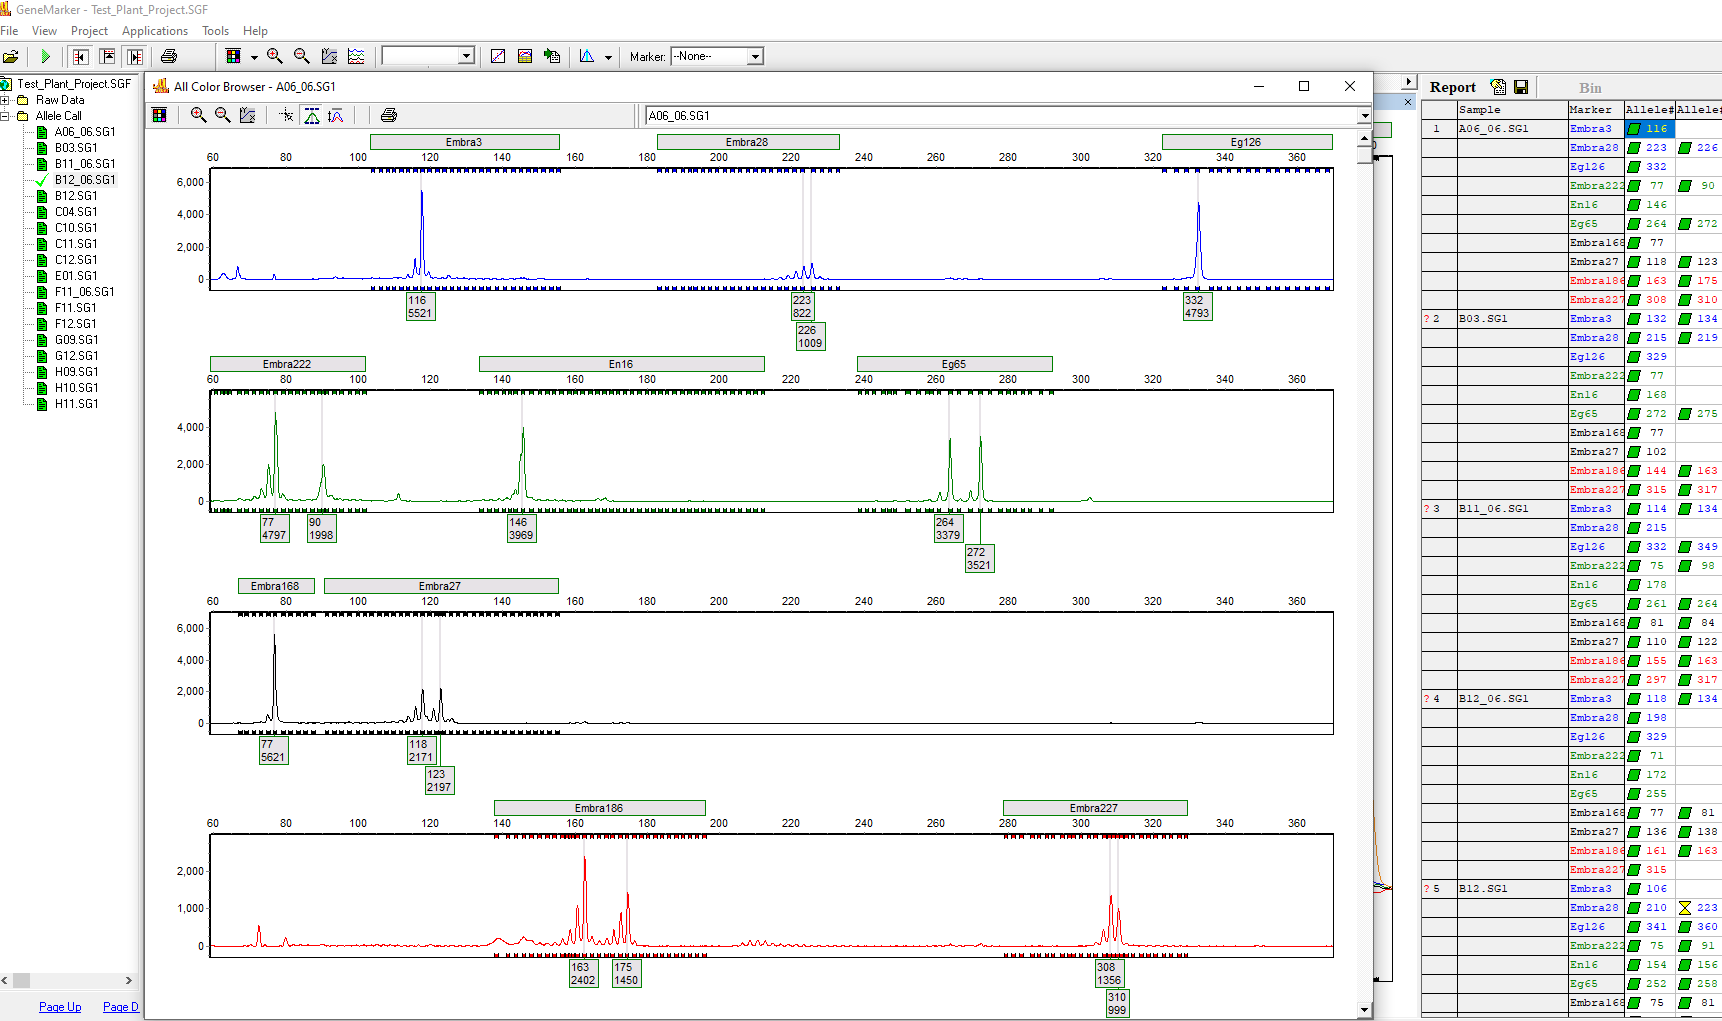
Figure 1: Review genotyping results and export or print electropherogram and genotype table results.
Linked Pedigree Tool
The user can either open an existing pedigree file of type .ped or create a new pedigree file in GeneMarker software's pedigree tool. The pedigree chart is designed to aid identification of inheritance patterns and abnormalities. All individuals in the pedigree with sample files are directly linked to the corresponding electropherograms with a mouse click, and individuals with illogical or abnormal allele calls are highlighted in red. The link between the pedigree and the electropherograms displaying allele calls for each marker make analysis makes analysis quick and efficient.
Pedigree Chart
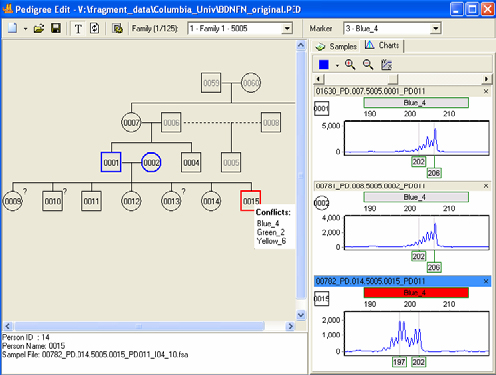
Figure 2: The pedigree chart above shows the inheritance conflicts.
Application Notes:
Webinars:
MLPA® is the registered trademark of MRC Holland