GeneMarker Genotyping Software: User-Friendly, Linked Navigation with Tools to Simplify Data Analysis and Provide Audit Trail
GeneMarker software automatically corrects for most instrument and chemistry errors, such as saturated peaks, noisy data, wavelength bleed-through, instrument spikes, and stutter peaks. GeneMarker software's automated Run Wizard (Figure 1) is designed to make repetitive analysis quick and accurate. The program is compatible with output files from all major sequencing systems, including ABI®PRISM, Applied Biosystems SeqStudio™, and Promega Spectrum Compact CE genetic analyzers. Additional tools in GeneMarker software include User Management, providing control of access rights with an audit trail and a Project Comparison tool to assist with validation studies and ensure consistent analysis for long term projects.
Analysis using GeneMarker software is intuitive and rapid. When the template is selected from the menu, or created by the user, the software automatically performs the analysis, providing a myriad of display and reporting options; analyzing up to 1000 lanes of capillary data in seconds. Linked navigation throughout the software reduces analyst fatigue and increases analysis efficiency. Once the analysis has been completed and confirmed the software saves all of the analysis parameters, raw data and results for easy archiving and call back at a future date.
Simple, Easy Operation
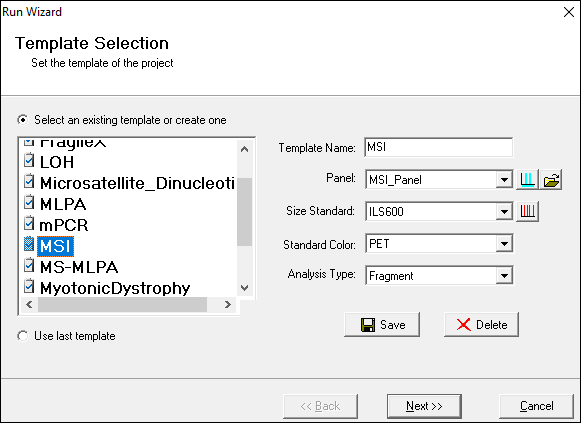
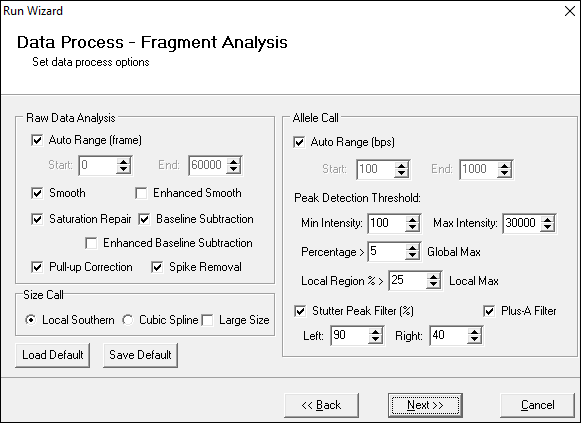
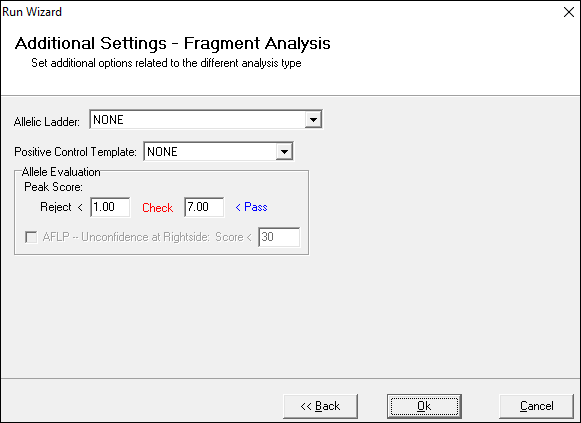
Figure 1: GeneMarker software's wizard simplifies parameter setting by "walking" the user through three simple steps. Templates can either be selected from several embedded templates or the user can create and save additional templates; detection settings are presented in one dialogue box that creates required flexibility in a simple to use format. Panel management and creation requires only a few mouse clicks! Saved analysis templates can be applied to subsequent analyses, increasing consistency while reducing analyst set up time.
Linked Navigation – Reduces Analyst Fatigue and Increases Efficiency
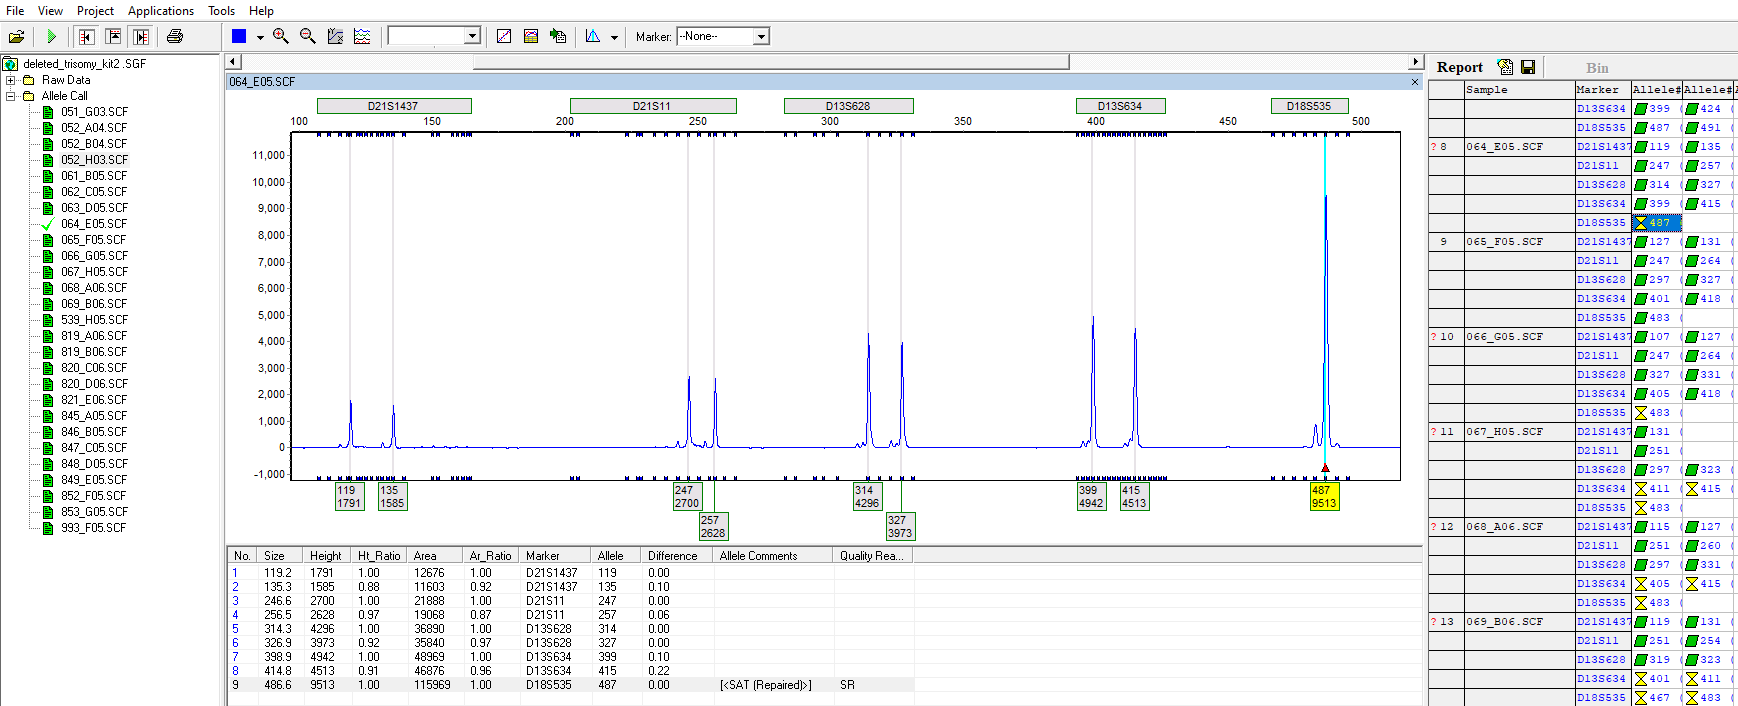
Figure 2: Green flagging of the sample names at the left side of the screen indicates high quality size calling (see details in Figure 3). The allele labels in the electropherogram indicate any peak that has fired one or more of the analysis rules. Linked navigation reduces analyst fatigue – click on the flagged peak to highlight the corresponding quality information in the peak tables
Evaluation of Sizing Quality
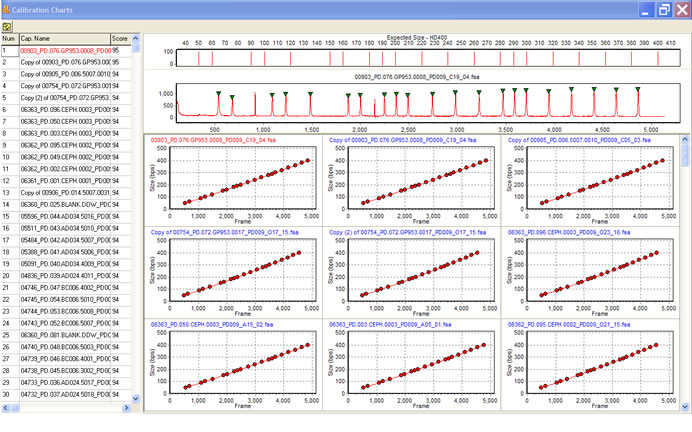
Figure 3: GeneMarker software provides a quality control graph indicating the linearity of the size call of each lane.
Webinars:
MLPA® is the registered trademark of MRC Holland


